Alteryx Designer Desktop Ideas
Share your Designer Desktop product ideas - we're listening!Submitting an Idea?
Be sure to review our Idea Submission Guidelines for more information!
Submission Guidelines- Community
- :
- Community
- :
- Participate
- :
- Ideas
- :
- Designer Desktop: New Ideas
Featured Ideas
Hello,
After used the new "Image Recognition Tool" a few days, I think you could improve it :
> by adding the dimensional constraints in front of each of the pre-trained models,
> by adding a true tool to divide the training data correctly (in order to have an equivalent number of images for each of the labels)
> at least, allow the tool to use black & white images (I wanted to test it on the MNIST, but the tool tells me that it necessarily needs RGB images) ?
Question : do you in the future allow the user to choose between CPU or GPU usage ?
In any case, thank you again for this new tool, it is certainly perfectible, but very simple to use, and I sincerely think that it will allow a greater number of people to understand the many use cases made possible thanks to image recognition.
Thank you again
Kévin VANCAPPEL (France ;-))
Thank you again.
Kévin VANCAPPEL
With a module that contains a lot of tool containers, it would be nice to have an option (similar to Disable All Tool That Write Output in the RunTime TAB) to disable all Tool Containers and then I can go pick the one or two that I would like to enable.
We needed to manually change this on our end but it would be nice if in 9.5 this easy upgrade was done already...
Currently I need to do a string function moving dates around to match a predefined syntax...
I have a big need to input files created in a .sqlite format and also write out to files as .sqlite that contain spatial object fields. Currently they are not recognized as spatial objects. BlobConvert is not able to convert the spatial fields from the input correctly (it gets close) so the result is that we are unable to utilize any spatial fields from or to these files.
Thanks.
Today i stuck in one position where my current module gaves an error because it doesnt found the Fields name. I define the field name in Formula tool for validation and harmonization. So as my Fields changes formula is also changes. But i donot want to make any changes in my Module.
So what i am thinking it will be better that we can define a formula in any file format like (.xlsx or .csv) and take the Input in formula tool.
So we do not have to change the module again and again. We just need to change the mapping file against the lates file coming. So we can check the file and define the formula in mapping file.
Thanks in Advance.
Hello,
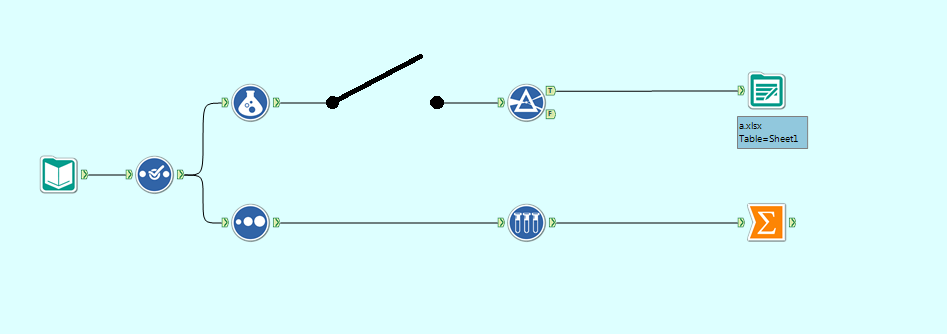
I think it would be extremely useful to have a switch connector available in Alteryx. What I mean by a switch connector is a connecting line with an on/off state that will block the data stream through it when off. Something like below:
Switch Connector in an "Off" state
This would be extremely useful when you only want data to flow down some of the paths. In the example above, I might turn the switch connector to off because I want to see the Summarize results without outputting to a document.
The current methods for having a path/set of tools present but unused are insufficient for my needs. The two methods I and Alteryx support were able to find were:
2. Putting the tools in a disabled tool container - I cannot see the tools when the container is disabled. I want to be able to see my tool set-up even when I am not using it.
This is inspired by the use of switches in electrical circuit design, such as:
Please comment if you also think this would be useful, or if you have ideas for ways to improve it further. Thank you!
I think it would be extremely useful to have a switch connector available in Alteryx. What I mean by a switch connector is a connecting line with an on/off state that will block the data stream through it when off. Something like below:
Switch Connector in an "Off" state
This would be extremely useful when you only want data to flow down some of the paths. In the example above, I might turn the switch connector to off because I want to see the Summarize results without outputting to a document.
The current methods for having a path/set of tools present but unused are insufficient for my needs. The two methods I and Alteryx support were able to find were:
2. Putting the tools in a disabled tool container - I cannot see the tools when the container is disabled. I want to be able to see my tool set-up even when I am not using it.
This is inspired by the use of switches in electrical circuit design, such as:

Please comment if you also think this would be useful, or if you have ideas for ways to improve it further. Thank you!
We've had several requests from clients for the ability to import password protected Excel spreadsheets into Alteryx. Within Alteryx, it would be good to specify the password and inport the file without the need to create an unprotected copy for use in Alteryx.
Thanks
I am not sure if this capability exists but I assume it does not.
We have a need to optimize a Linear Program (LP) model that consists of a system of equations and has both:
An objective function and a series of constraints. One of the software capabilities that SAS offers that currently
Alteryx does not have is this optimization capability.
I am wondering if the capability is currently not available, is this capability in the Product Roadmap?
Thanks,
Ricardo
Instead of having multiple filters to create mutliples new branches for downstream analysis, Alteryx should have one filter with multiples ouputs ports. Each filter would is own statement.
This would reduce the numbers of filters in a canvas.
Possibility to deselect fields directly in the input (shape, csv, tab, etc).
It would be nice to have the annotations that a user gives a tool with a different background color on the canvas than those tools where the annotation is being automatically populated. Example would be the user gives a tool a specific name that shows up in blue but the formula tools that display the formula preview under the tool show up in yellow.
I have been using the outputs from Spline Regression to facillitate analysis of demographic data (specifically Department of Labor Quarterly Employment data). I have data from 1992Q1 to 2014Q1 and use Spline Regression to get fitted values for each quarter with predictors being the year/quarter, Year/quarter multiplied by a dummy variable for each of the 4 US Presidents, and a dummy variable for each president.
So I can compare results across various groupings by geographic, and other levels as well as the BLS aggregation level. I can analyze raw data or have the values to be fitted indexed to 1992Q1.
I use the default settings for Spline and it builds the best fit including where the node periods for each spline section. To help interpret the results, though, I use the output to compare the actual vs. fitted values (e.g. employment Level) and then look at the changes by quarter.
With the spline regression building the best model with optimal line segments, the results make it possible to see how employment progress or regress correletat with with presidential terms of office or specific impacts of economic recessions on employment data.
I can supply an example of the process, if anyone is interested.
I'd appreciate any comments and/or suggestions to improve the process or interpret the results.
Please add Google Spreadsheets to be an option in the Input Tool.
Tim
Thanks!
To keep from being too specific, the "Idea" is that Alteryx Designer should do better at recognizing and handling Date/Times on input. Thoughts include:
1) Offer more choices in the Parse: DateTime tool, including am/pm.
2) Allow users to add new formats to the Parse: DateTime lists.
3) Include user-added formats in the Preparation: Auto Field tool's library.
4) Don't require zero-padding of days and hours in the DateTimeParse() function. (1/1/2014 1:23:45 AM looks enough like a date that DateTimeParse() should be able to figure it out, but it stumbles on day and hour.)
My particular difficulty is that I have incoming date/times with AM/PM components. I've gone ahead and created a macro to take care of that for now, but it certainly seems like that sort of thing would be handled automatically.
Thanks!
- New Idea 253
- Accepting Votes 1,818
- Comments Requested 25
- Under Review 167
- Accepted 56
- Ongoing 5
- Coming Soon 11
- Implemented 481
- Not Planned 118
- Revisit 65
- Partner Dependent 4
- Inactive 674
-
Admin Settings
20 -
AMP Engine
27 -
API
11 -
API SDK
218 -
Category Address
13 -
Category Apps
112 -
Category Behavior Analysis
5 -
Category Calgary
21 -
Category Connectors
245 -
Category Data Investigation
76 -
Category Demographic Analysis
2 -
Category Developer
208 -
Category Documentation
80 -
Category In Database
214 -
Category Input Output
636 -
Category Interface
238 -
Category Join
102 -
Category Machine Learning
3 -
Category Macros
153 -
Category Parse
76 -
Category Predictive
77 -
Category Preparation
390 -
Category Prescriptive
1 -
Category Reporting
198 -
Category Spatial
81 -
Category Text Mining
23 -
Category Time Series
22 -
Category Transform
87 -
Configuration
1 -
Data Connectors
958 -
Data Products
2 -
Desktop Experience
1,521 -
Documentation
64 -
Engine
125 -
Enhancement
312 -
Feature Request
212 -
General
307 -
General Suggestion
4 -
Insights Dataset
2 -
Installation
24 -
Licenses and Activation
15 -
Licensing
11 -
Localization
8 -
Location Intelligence
80 -
Machine Learning
13 -
New Request
186 -
New Tool
32 -
Permissions
1 -
Runtime
28 -
Scheduler
24 -
SDK
10 -
Setup & Configuration
58 -
Tool Improvement
210 -
User Experience Design
165 -
User Settings
77 -
UX
223 -
XML
7
- « Previous
- Next »
- rpeswar98 on: Alternative approach to Chained Apps : Ability to ...
-
 caltang
on:
Identify Indent Level
caltang
on:
Identify Indent Level
- simonaubert_bd on: OpenAI connector : ability to choose a non-default...
- nzp1 on: Easy button to convert Containers to Control Conta...
-
Qiu
on:
Features to know the version of Alteryx Designer D...
- DataNath on: Update Render to allow Excel Sheet Naming
- aatalai on: Applying a PCA model to new data
- charlieepes on: Multi-Fill Tool
- seven on: Turn Off / Ignore Warnings from Parse Tools
- vijayguru on: YXDB SQL Tool to fetch the required data
| User | Likes Count |
|---|---|
| 85 | |
| 14 | |
| 10 | |
| 7 | |
| 5 |