Alteryx Designer Desktop Ideas
Share your Designer Desktop product ideas - we're listening!Submitting an Idea?
Be sure to review our Idea Submission Guidelines for more information!
Submission Guidelines- Community
- :
- Community
- :
- Participate
- :
- Ideas
- :
- Designer Desktop
Featured Ideas
Hello,
After used the new "Image Recognition Tool" a few days, I think you could improve it :
> by adding the dimensional constraints in front of each of the pre-trained models,
> by adding a true tool to divide the training data correctly (in order to have an equivalent number of images for each of the labels)
> at least, allow the tool to use black & white images (I wanted to test it on the MNIST, but the tool tells me that it necessarily needs RGB images) ?
Question : do you in the future allow the user to choose between CPU or GPU usage ?
In any case, thank you again for this new tool, it is certainly perfectible, but very simple to use, and I sincerely think that it will allow a greater number of people to understand the many use cases made possible thanks to image recognition.
Thank you again
Kévin VANCAPPEL (France ;-))
Thank you again.
Kévin VANCAPPEL
The Alteryx produced macros which are available as downloads on gallery should be yxi (Alteryx installer) files instead of yxzp (packaged workflows) as this will put the tools into the correct tool palette.
For example the time series factory tools should appear in the time series tool palette when they are installed.
I am bringing this over from this post.
It would be really cool to have a workflow that you could configure to your server that we could schedule to pull down the new Cass updates and install them. Since they have to be reinstalled every two months, it would help to manage that.
I think that the data updates are set up with an FTP site, Cass could be done essentially the same way. Download it there and then use the command module to run the install? I may be over simplifying the process but it seems like this is something that Alteryx could tackle.
As of today, you must use a data stream out and then a hdfs tool to write a table in the hdfs in csv. Giving that the credentials are the same and that the adress in the DSN is the adress of the hdfs, it seems possible to keep the data in Hadoop and just putting it from the base to the HDFS.
I'm only just starting to explore the python and html sdks, but I think this functionality would be really useful for Alteryx tools.
I foresee cases where a custom tool is developed and we want to install it for 20+ users. Rather than having each user manually open and install the file, and troubleshooting for each of them (which could also become challenging if we want to deploy an enhancement to a tool in the future), I'd like a method (preferably via command line) to automatically install a tool for a user without any interaction/input.
This would allow for targeted tool deployment as well as large-scale tool maintenance as custom Python tools mature in the enterprise space.
MDX Queries such as SSAS Cubes, SAP InfoCubes or Hyperion Essbase would be greatly appreciated. Tableau has these connectors, and being partners with Tableau you can leverage the work they have done in this space.
(originally raised as discussion : https://community.alteryx.com/t5/Data-Sources/Input-Data-Tool-Record-Limit-control/td-p/58718)
Hi all,
When using a record limit on a database query - the actual query being executed on the server depends very much on the connection type (Native SQL; OleDB; and ODBC). However, for all 3 of these, it seems that the record limit is being enacted on the client side, not on the server. What I mean by this is that when I take the exact queries that are being run by Alteryx on the server (by looking at a SQL Profile trace on the server), and run these in a query window, you can see that the row-limit is not occurring in SQL, but in Alteryx.
(to test this, I ran several queries with and without the record limit; profiled them using SQL profiler; and the profile trace was identical either way)
Aside from putting "Select top(100) from..." in all the queries that that we create, or using in-DB queries for every simple query - could we instead have an option to force the row limitation down to the server on a regular InputData tool, so that we can take advantage of the server's ability to optimize?
Thank you
Sean
When bringing data together it is often needed to assign a source to the data. Generally this happens when you union data and need to know things later about the data for context. It would save time to generate a source field that is assigned based upon the input connections of the union tool. Perhaps when unioning data you can assign a name to each input stream?
Hello,
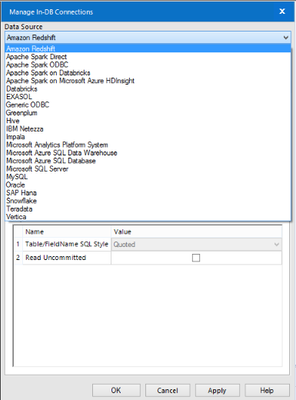
As of today, if you want to add a PostgreSQL in database connection, you may feel embarrased :
However, the help states that PostgreSQL is supported by in-database.
https://help.alteryx.com/current/In-DatabaseOverview.htm
Whaaaaaaaaat?
oh, I forgot to mention : with a little luck, you can find tis help page : https://help.alteryx.com/current/DataSources/PostgreSQL.htm
Yep, you have to configure a "greenplum" connection if you want to use a PSQL.
i think this is not user-friendly and can lead to mistake, errors, frustration and even lack of sales for Alteryx :
Also, Greeenplum and PSQL will have separate features so I think having two separate entries in the menu is pertinent.
Best regards,
Simon
In order to speed up our workflows (which are very heavily tied to databases and DB queries) it would be valuable to be able to inspect the actual queries which were run against the SQL server so that we can index to optimize these queries directly in SQL Enterprise Manager (or the same on any DB platform - we have the same problem on DB2)
The idea would be to have a simple screen where I can run the workflow with a SQL profiling turned on, and then capture the output of either the entire workflow (grouped by connection so that I can tune one database with only the queries that apply) or a specific component on the canvas.
I appreciate that this is not something that would be required by a fair population of your users - but I'm sure that this will be helpful for any enterprise / corporate customers.
Thank you
Sean
When the append tool detects no records in the source, it throws a warning. I would like to have the ability to supress this warning. In general, all tools should have similar warning/error controls.
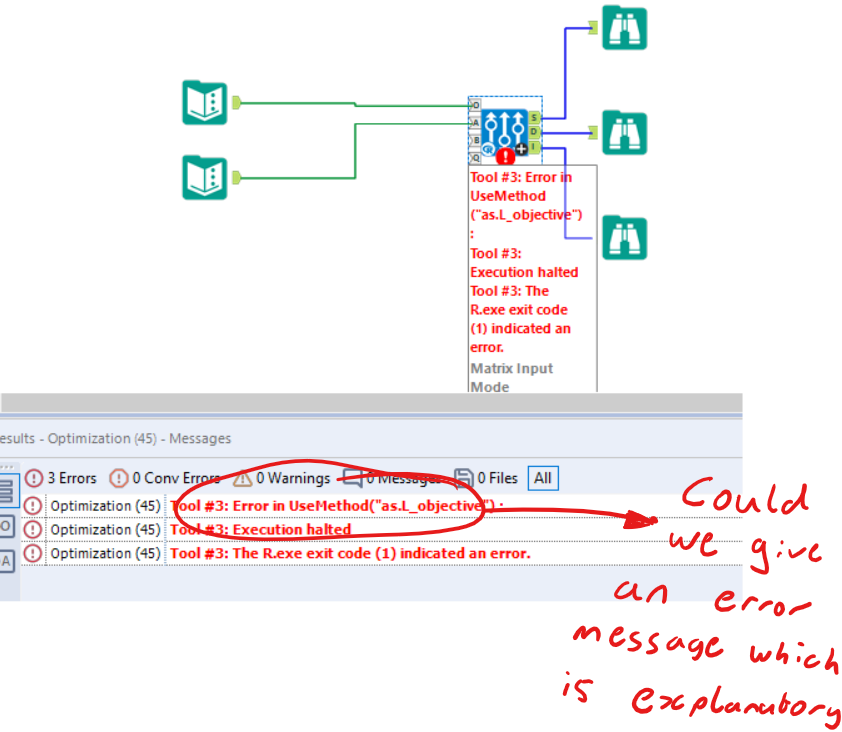
The Optimize tool is a very useful capability - and if we could improve the error messaging then it would be much more approachable for users to learn and make use of.
For example - the error message in the attached image - could we please update this to provide information about what went wrong, and how to fix it?
Many thanks
When you drag a comment box into a workflow it should sit underneath all other data tools by default.
Currently, the order of tools is set by the order of placement (that is, tools placed in the workflow first are placed below subsequently placed tools).
At our Customer we are using SAP HANA as our main database. in the moment we can only use the ODBC Client to connect against SAP HANA. In this scenario it is only possible to establish a connection with Username and Password. It would be very good if every Alteryx Designer user can connect via SSO to the HANA Database. It would be perfect to have this as standard feature and not through an add-on.
In user settings you can define a "Logging Directory" and if you do the system will send the Output Log (Results view messages) to a file in that folder. The name generated is Alteryx_Log_ + an apparent sequential number, example: Alteryx_Log_1519833221_1.
This makes it impossible to identify which flow it is associated with and which instance of execution simply by looking at the name, you have to parse the content to see the flow name and start/end timestamps. For trouble shooting we want to be able to look at the list of file names and quickly see which file, of possibly hundreds of files, we need to look at to see what went wrong.
On shared collection , users have access to the collection shared by other team members. When users copy the ‘Publish to Tableau Server ‘ tool from one workflow to another it copies with the credentials embedded in the tool as well.
As user John Doe’s workflow publishes data on to tableau server with Peter’s credentials as the publish to dashboard tool was copied from Peter’s workflow.
The concern really is Users copying tools from one workflow can really copy the credentials as well. Enhancement to the publish to Tableau tool would be much appreciated.
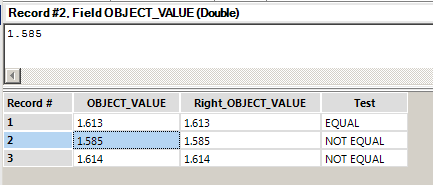
I would love to see Alteryx add an indicator whenever a number being displayed is being truncated. For example, this picture is currently confusing:
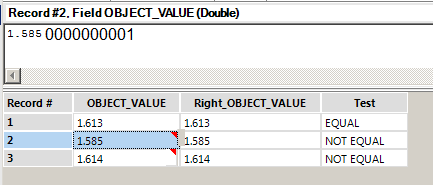
The displayed numbers should all be equal according to their displayed value, but in reality a different number is being stored in the background. I would propose something like this:
1) Any number that is being truncated when displayed would have that red triangle in the upper right corner. This already happens when a formula tool result is truncated, but I would like for it to be displayed on all data.
2) Clicking on the cell would show the actual value, not the truncated value. This would be great when debugging.
I understand that numbers are more complex than meets the eye, and I think that changes like this would help alleviate some of the mystery (like why 2 of my numbers above aren't equal).
Right now - if a tool generates an error - there is nothing productive that you can do with the error rows, these are just sent to the error log and depending on your settings the entire canvas will fail.
Could we change this in the Designer to work more like SSIS - where almost every tool has an error output, so that you can send the good rows one way, and the error rows the other way, and then continue processing? The error rows can be sent to an error table or workflow or data-quality service; and the good rows can be sent onwards. Because you have access to the error rows, you can also do run stats of "successful rows vs. unsuccessful"
This would make a big difference in the velocity of developing a canvas or prepping data.
Can take some screenshots if that helps?
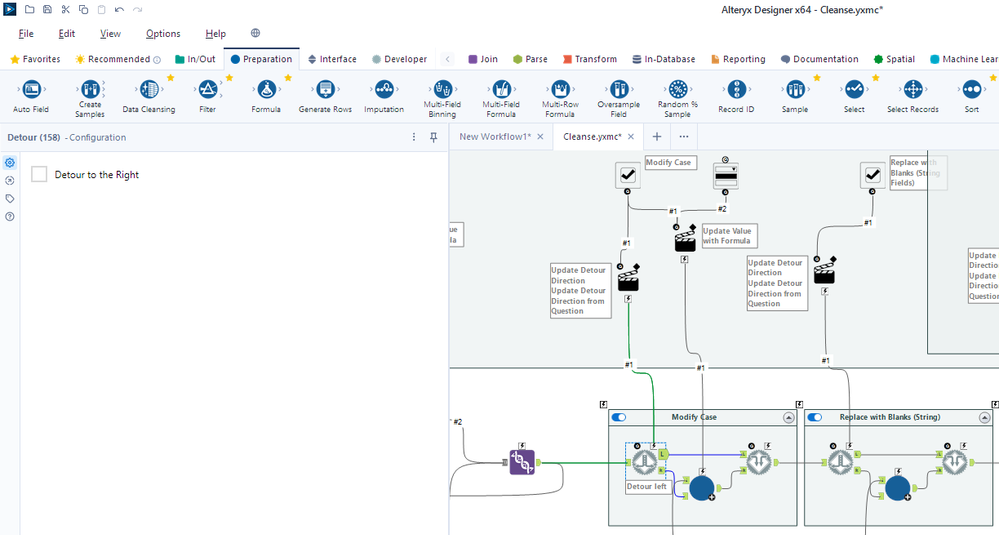
It would be nice to have a visual cue for a detour tool's configuration. This is especially the case when testing with several detour tools in a workflow - see the cleanse.yxmc screenshot below. I added an annotation to one of the detour tools as a possible solution.
Any of these options that would save the additional click would be appreciated.
- Default annotation shows "Detour left" or "Detour right"
- Detour outgoing wire highlighted (mentioned in Detour dashing)
- Detour direction outgoing anchor that is NOT used is grayed out
- Detour direction outgoing wire that in NOT used is grayed out
- Detour tool has a left/right toggle
- Detour tool changes color when set to detour right
Personally, I prefer that the outgoing anchor and outgoing wire not in use be grayed out. But even the default annotation stating the direction would be helpful.
Does anyone else have a preference or other ideas on the visual cues?
In the moment we using Alteryx and Tableau to publish data from the Azure environment. In our focus is to publish the data with the ADLS Connector. For us would be perfect if as well parquet would be supported. In end we are in competition against PowerBI and these software supports parquet files.
My company has recently purchased some Alteryx licences with the hope of advancing their Data Science capability. The business is currently moving all their POS data from in-premise to cloud environment and have identified Azure Cosmos DB as a perfect enviornment to house the streaming data. Having purchased the Alteryx licences, we have now a challenge of not being able to connect to the Azure Cosmos DB environment and we would like Alteryx to consider speeding up the development of this process.
- New Idea 275
- Accepting Votes 1,815
- Comments Requested 23
- Under Review 173
- Accepted 58
- Ongoing 6
- Coming Soon 19
- Implemented 483
- Not Planned 115
- Revisit 61
- Partner Dependent 4
- Inactive 672
-
Admin Settings
20 -
AMP Engine
27 -
API
11 -
API SDK
218 -
Category Address
13 -
Category Apps
113 -
Category Behavior Analysis
5 -
Category Calgary
21 -
Category Connectors
247 -
Category Data Investigation
77 -
Category Demographic Analysis
2 -
Category Developer
208 -
Category Documentation
80 -
Category In Database
214 -
Category Input Output
641 -
Category Interface
240 -
Category Join
103 -
Category Machine Learning
3 -
Category Macros
153 -
Category Parse
76 -
Category Predictive
77 -
Category Preparation
394 -
Category Prescriptive
1 -
Category Reporting
198 -
Category Spatial
81 -
Category Text Mining
23 -
Category Time Series
22 -
Category Transform
89 -
Configuration
1 -
Content
1 -
Data Connectors
964 -
Data Products
2 -
Desktop Experience
1,538 -
Documentation
64 -
Engine
126 -
Enhancement
331 -
Feature Request
213 -
General
307 -
General Suggestion
6 -
Insights Dataset
2 -
Installation
24 -
Licenses and Activation
15 -
Licensing
12 -
Localization
8 -
Location Intelligence
80 -
Machine Learning
13 -
My Alteryx
1 -
New Request
194 -
New Tool
32 -
Permissions
1 -
Runtime
28 -
Scheduler
23 -
SDK
10 -
Setup & Configuration
58 -
Tool Improvement
210 -
User Experience Design
165 -
User Settings
80 -
UX
223 -
XML
7
- « Previous
- Next »
-
NicoleJ on: Disable mouse wheel interactions for unexpanded dr...
- TUSHAR050392 on: Read an Open Excel file through Input/Dynamic Inpu...
- NeoInfiniTech on: Extended Concatenate Functionality for Cross Tab T...
- AudreyMcPfe on: Overhaul Management of Server Connections
-
AlteryxIdeasTea
m on: Expression Editors: Quality of life update - StarTrader on: Allow for the ability to turn off annotations on a...
- simonaubert_bd on: Download tool : load a request from postman/bruno ...
- rpeswar98 on: Alternative approach to Chained Apps : Ability to ...
-
caltang on: Identify Indent Level
- simonaubert_bd on: OpenAI connector : ability to choose a non-default...
| User | Likes Count |
|---|---|
| 20 | |
| 9 | |
| 7 | |
| 6 | |
| 5 |
