Alteryx Designer Desktop Ideas
Share your Designer Desktop product ideas - we're listening!Submitting an Idea?
Be sure to review our Idea Submission Guidelines for more information!
Submission Guidelines- Community
- :
- Community
- :
- Participate
- :
- Ideas
- :
- Designer Desktop: Top Ideas
Featured Ideas
Hello,
After used the new "Image Recognition Tool" a few days, I think you could improve it :
> by adding the dimensional constraints in front of each of the pre-trained models,
> by adding a true tool to divide the training data correctly (in order to have an equivalent number of images for each of the labels)
> at least, allow the tool to use black & white images (I wanted to test it on the MNIST, but the tool tells me that it necessarily needs RGB images) ?
Question : do you in the future allow the user to choose between CPU or GPU usage ?
In any case, thank you again for this new tool, it is certainly perfectible, but very simple to use, and I sincerely think that it will allow a greater number of people to understand the many use cases made possible thanks to image recognition.
Thank you again
Kévin VANCAPPEL (France ;-))
Thank you again.
Kévin VANCAPPEL
Products Team: Could you tell me if this is on the future road map or not?
It's something that other software does utilize, and I've seen similar requests on this message board.
Many companies use per period, quarter, year, etc. that aren't equal lengths or same days each month.
By saying every 364 days, you can schedule a yearly report. If your 4 quarters are unequal length, you can schedule 4 times (1st day of each quarter) at 364 days, recurring.
We have lengths of every 28 days for monthly reports (not 30/31). Or every 90 days. Or 180 days. Or every 14 days.
Being able to Schedule Every N Days moves you from owning a scheduler, to a providing a Competitive Scheduler.
-
Feature Request
-
Setup & Configuration
Can we have an option to save a workflow in a prior version for backward compatibility? I think Tableau offers this functionality.
Example:
If I have 2019.4.8 and a colleague has 2019.1.x, I cannot share my workflows because my colleague will receive a notice that the workflow was built in a newer version. I want to be able to save my workflow in 2019.1.x and send to my colleague.
This is predicated on the workflow not containing any tools/features not present in the older version. In that case, give me a warning about the specific tools/features that are not backward compatible. Thank you.
-
Engine
-
Feature Request
-
General
-
User Experience Design
As an admin - we currently need to download a large number of different binaries for every release; then package them for internal deployment; then send them out.
This creates unnecessary work for our admin teams, our packaging teams, our deployment teams etc.
This problem is becoming more acute now that Alteryx is shipping add-on tools via the public gallery - so our standard desktop designer can now require 10 or more separately packaged installs.
Can we please change the download experience to allow enterprise admins to:
- Select the components that they want in a standard download
- This would allow for a menu selection across all the starter kits (e.g. Tableau; microsoft; qlik); the standard designer; the predictive
- it would also allow for a menu selection across public gallery assets so that we can include things like the model comparison tool and other new predictive capabilities
- the addins for Microsoft R Server
- database drivers
- Connect data loaders
- Server components
- Given this set a name (like "Standard designer install") since in a large enterprise we will have several different configurations (some for super-users; some for standard users). In our world we'd have "Standard Designer"; "Admin"; "Connect Controller"; "SuperUser" as our starting list.
- Then download one installer which is the aggregated set of these in one place
- ... and finally allow the Admin to be notified when any component in the install set changes so that they can download the new version.
-
Feature Request
-
General
-
Tool Improvement
The new Paste Before/After feature is awesome, as is the Cut & Connect Around.
https://community.alteryx.com/t5/Alteryx-Designer-Ideas/Paste-Before-After/idc-p/510292#M12071
What would be even better is to allow the combination of the two. E.G. It is not currently possible to copy or cut multiple tools and paste before/after, as this functionality only works for a single tool that's copied.
Thanks,
Joe
-
Feature Request
-
General
-
Tool Improvement
-
User Experience Design
I see many posts where users want to view numeric or string data as monetary values. I think that it would be friendly to have a masking option (like excel) where you could choose a format or customize one for display. The next step is to apply the formatting to the workflow so that folks who want to export the data can do so.
cheers,
mark
-
Feature Request
-
Localization
-
Tool Improvement
-
User Experience Design
I recently had an error in a module because an expected variable was not present coming into a formula tool. My variable, "MONDAY" was not present and the formula MONDAY/3 failed. The workaround was to union all days into the incoming data and things worked fine. I would have liked to have an Excel formula like this instead:
IF ISERROR([Monday]/3) THEN 0 ELSE [Monday]/3 ENDIF
Thanks
-
Feature Request
-
General
-
Tool Improvement
I was just thinking how nice it would be to have an IfError function like there is in Excel. With Alteryx's design, there isn't really much need for the function. I just ran into a case today where I thought it might be useful. There was a function created after a crosstab that expected certain field names to exist. I got around this by using filter, summarize, and join tools instead.
It just stuck with me that it would be much easier to just say:
IfError([FieldThatDoesNotExist],0)
Something like this could also be used when referencing a field which has a calculation that produces an error.
I don't know if something like this would be completely antithetical to Alteryx's design, but there are times when it would definitely be convenient.
-
Feature Request
For the purposes of troubleshooting/optimization, it might come in handy to have a timestamp column in the Results Pane. Especially with processes time-consuming enough that I let them run in the background, I would like to know which steps are particularly time consuming, and seeing when the messages were generated would at least be a start.
-
Feature Request
I usually don't mind the bell sound at the completion of workflow run. But when wearing earphones the ding can be a bit jarring.
There is a "fix" as evidenced here: https://community.alteryx.com/t5/Alteryx-Designer-Discussions/Remove-Workflow-Completion-Sound/td-p/...
Another option is to use the Sound Mixer to mute system sounds
However, we could enjoy more granular control if we could mute the sound within Designer. An option to choose our own Alteryx-specific sound would be gravy.
Thank you for your consideration.
Sincerely,
David
-
Feature Request
I would like to have all my annotations show on top of the tools by default. I can change them one at a time, but I would like to be able to change the default setting to be "Show Annotations on the Top" always.
-
Feature Request
-
General
-
User Experience Design
Hello Dev Gurus -
The message tool is nice, but anything you want to learn about what is happening is problematic because the messages you are writing to try to understand your workflow are lost in a sea of other messages. This is especially problematic when you are trying to understand what is happening within a macro and you enable 'show all macro messages' in the runtime options.
That being said, what would really help is for messages created with the message tool to have a tag as a user created message. Then, at message evaluation time, you get all errors / all conversion warnings / all warnings / all user defined messages. In this way, when you write an iterative macro and are giving yourself the state of the data on a run by run basis, you can just goto a panel that shows you just your messages, and not the entire syslog which is like drinking out of a fire hose.
Thank you for attending my ted talk regarding Message Tool Improvements.
-
API SDK
-
Category Developer
-
Feature Request
-
Tool Improvement
I'd consider myself as a power user in most of the tools I use. No matter what program it is, I try to learn most of the useful shortcuts and code them into my mouse or keypad.

It's probably pretty uncommon that someone uses a mouse with 12 extra keys or a keypad, but I think many people would be happy to have the option to define shortcuts for everything. I don't really ask for shortcuts for everything by default, but a menu like Microsoft Word has it, that would be great.
For reference:
Microsoft Word has a menu were nearly every possible action is listed and you are able to define/assign shortcuts (one or more) for every action available.

(Sorry it's German. Path: File > Options > Customize Ribbon > Customize)
-
Feature Request
-
General
-
User Experience Design
For deeply structured XML - it would be very helpful to be able to search XML (as you would using the DOM). Even better would be to implement XML Query capability (a visual tool) within Alteryx so that XML data can be directly queried: https://en.wikipedia.org/wiki/XQuery
-
Feature Request
-
General
I've had the need to Find & Replace inside of a formula that I've written. Would it be possible to have that type of functionality inside of the expression builder?
Does anyone else think that it would be useful?
-
Feature Request
-
General
I'm digging the new holistic data view in the browse; however, there is one aspect of the old view that I miss: I liked the list of top values to be available without scrolling. Here is the current view of the new browse:

What are my top values? I either need to hover over the blue bars, or scroll down to see the list at the bottom. I would like the top values list moved to the top. For reference, here is what the old view looked like:

My top values are available right there at the top.
-
Feature Request
-
User Experience Design
Working across a large organisation inevitably leads to people using different drive letters when mapping drives/folders. This makes sharing workflows and macros with other teams more difficult and the first thing I do when creating a new workflow is change the dependencies to All UNC.
This suggestion is to offer the option to default all workflows to UNC via the user settings. Acknowledging that some users will prefer listing files by drive letter and other UNC, adding the option could make life a little bit easier for everyone.
-
Feature Request
-
User Experience Design
Be able to have a round function similar to Excel's Round Function. Basically, be able to round "5 and up" or "4 and down" based on the number of decimal spaces we choose. This would be similar to what is taught in grade school and would resolve 80% to 90% of the rounding issues in Alteryx. Most of rounding solutions provided are too technical and worthless. This is very basic and common sense. (FYI - I don't know if this helps, but I believe Excel only goes out to 13 decimal places before cutting it off, maybe if Alteryx could do the same with the rounding it would be helpful.
Currently I'm pulling the exact same data through two different workflows, and getting two different amounts slightly off from each even though both use the same raw data source and datatype.
-
Feature Request
It would be nice if you could add blank space or separators between elements in the visual layout tool.
I want some additional spacing between data tables/charts.
Currently, my work around is adding a blank report text box. It is not the most streamlined solution, but works.
-
Feature Request
Hello Product Management,
I'm trying to emulate a graph from the book, Effective Data Visualization by Dr. Stephanie Evergreen. Here's what I have so far:

This was a little bit of work to create and while it isn't what I exactly had hoped for, it does approximate my attempt. Ideally, I would do the following to complete the exercise:
- Have a Y-Axis (none) line on for both Old/New Sites (dual-axis)
- Replace the Y-Axis number with the Label for the departments
- Remove the (line) from the label
As observations, in order to add carriage returns to NOTES, i had to use HTML tags <br>. The settings for points and lines required me to do lots of configuration. Maybe a format painter would help to copy the format from one set of point/lines to the next. Once I completed a chart/insight it would be "nice" to be able to copy and configure the other. If you have an insight and wish to create a chart, you have to reconfigure the new element from scratch.
I do have an error in the creation of the chart that says, "Error parsing configuration." I have no idea what error exists. I submitted a ticket on that issue.
I haven't created this chart via Excel, but the textbook shows you how to create the result in Excel. The graph is easy for me to see and to understand. I like it and think that it could be a valuable way to demonstrate the potential for Alteryx visualizations.
Cheers,
Mark
-
Category Reporting
-
Desktop Experience
-
Feature Request
For people recently met with RegEx, you are lucky if the expression is short and understandable or "human readable".
But there are extreme cases too where it's really a pain to solve the puzzle.
if you'd like to catch e-mail addresses from masses of unstructured data this will work;
/^([a-z0-9_\.-]+)@([\da-z\.-]+)\.([a-z\.]{2,6})$/
and here is the elaboration;
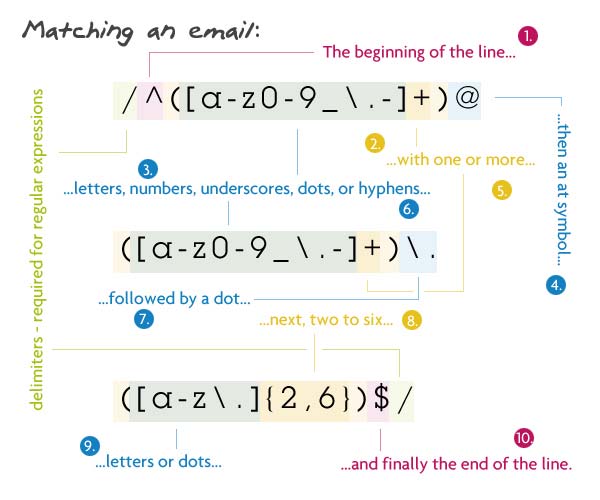
when colorful it's fun but barely readable still... Here is a Regexper version

This visualizer I came across at https://regexper.com/ is awesome.
- Can you please integrate this into Designer for ease of reading and understanding existing RegEx...
- Can it be possible to develop an interactive tool to prepare;
- The graphical representation of our regular expression first
- And then writing it in the same old fashion...
Please support the idea if you like...
-
Feature Request
-
User Experience Design
- New Idea 275
- Accepting Votes 1,815
- Comments Requested 23
- Under Review 173
- Accepted 58
- Ongoing 6
- Coming Soon 19
- Implemented 483
- Not Planned 115
- Revisit 61
- Partner Dependent 4
- Inactive 672
-
Admin Settings
20 -
AMP Engine
27 -
API
11 -
API SDK
218 -
Category Address
13 -
Category Apps
113 -
Category Behavior Analysis
5 -
Category Calgary
21 -
Category Connectors
247 -
Category Data Investigation
77 -
Category Demographic Analysis
2 -
Category Developer
208 -
Category Documentation
80 -
Category In Database
214 -
Category Input Output
641 -
Category Interface
240 -
Category Join
103 -
Category Machine Learning
3 -
Category Macros
153 -
Category Parse
76 -
Category Predictive
77 -
Category Preparation
394 -
Category Prescriptive
1 -
Category Reporting
198 -
Category Spatial
81 -
Category Text Mining
23 -
Category Time Series
22 -
Category Transform
89 -
Configuration
1 -
Content
1 -
Data Connectors
964 -
Data Products
2 -
Desktop Experience
1,538 -
Documentation
64 -
Engine
126 -
Enhancement
331 -
Feature Request
213 -
General
307 -
General Suggestion
6 -
Insights Dataset
2 -
Installation
24 -
Licenses and Activation
15 -
Licensing
12 -
Localization
8 -
Location Intelligence
80 -
Machine Learning
13 -
My Alteryx
1 -
New Request
194 -
New Tool
32 -
Permissions
1 -
Runtime
28 -
Scheduler
23 -
SDK
10 -
Setup & Configuration
58 -
Tool Improvement
210 -
User Experience Design
165 -
User Settings
80 -
UX
223 -
XML
7
- « Previous
- Next »
-
 NicoleJ
on:
Disable mouse wheel interactions for unexpanded dr...
NicoleJ
on:
Disable mouse wheel interactions for unexpanded dr...
- TUSHAR050392 on: Read an Open Excel file through Input/Dynamic Inpu...
- jackchoy on: Enhancing Data Cleaning
- NeoInfiniTech on: Extended Concatenate Functionality for Cross Tab T...
- AudreyMcPfe on: Overhaul Management of Server Connections
-
AlteryxIdeasTea
m on: Expression Editors: Quality of life update - StarTrader on: Allow for the ability to turn off annotations on a...
- simonaubert_bd on: Download tool : load a request from postman/bruno ...
- rpeswar98 on: Alternative approach to Chained Apps : Ability to ...
-
 caltang
on:
Identify Indent Level
caltang
on:
Identify Indent Level
| User | Likes Count |
|---|---|
| 16 | |
| 9 | |
| 7 | |
| 5 | |
| 4 |