Alteryx Designer Desktop Ideas
Share your Designer Desktop product ideas - we're listening!Submitting an Idea?
Be sure to review our Idea Submission Guidelines for more information!
Submission Guidelines- Community
- :
- Community
- :
- Participate
- :
- Ideas
- :
- Designer Desktop: New Ideas
Featured Ideas
Hello,
After used the new "Image Recognition Tool" a few days, I think you could improve it :
> by adding the dimensional constraints in front of each of the pre-trained models,
> by adding a true tool to divide the training data correctly (in order to have an equivalent number of images for each of the labels)
> at least, allow the tool to use black & white images (I wanted to test it on the MNIST, but the tool tells me that it necessarily needs RGB images) ?
Question : do you in the future allow the user to choose between CPU or GPU usage ?
In any case, thank you again for this new tool, it is certainly perfectible, but very simple to use, and I sincerely think that it will allow a greater number of people to understand the many use cases made possible thanks to image recognition.
Thank you again
Kévin VANCAPPEL (France ;-))
Thank you again.
Kévin VANCAPPEL
Hi team,
Currently, we can FILTER results in the result window using some string operations like "String equals", "String Contains", etc.
Firstly, it's a great feature. Kudos for the same.
However, it would be really helpful if we can add the IN operator functionality to this Result window FILTER.
Most of the time, we always want to check for multiple values while filtering the data.
I am attaching a screenshot of the FILTER location that I am referring to!

For eg, In the above screenshot of the result window, I want to filter for Name IN ('Bullock County','Baldwin County','Butler County')
Kindly look into this.
Thanks in advance.
Regards,
Shreyansh Rathod
Right now it is not possible to open .xlsx files in Alteryx that has restricted access to specific users from the excel file, even when you are logged in to Alteryx and Excel with the same user. If it is possible to make Alteryx recognize which users/email addresses should be able to input a file to Alteryx I think it would be a great enhancement. To get around the problem we are currently changing the file restrictions through right clicking on it -> Properties -> Security, but this is time consuming and not a smooth fix.
All the best,
Elin
We need a way to set data type on every input tool, but most importantly with the "Macro input" tool!
Making macros is a pain because of this.
When I click the Metadata tab on the 'Macro input' it's all wrong.
I've tried using the tool's 'Text input' to give example data, but it still comes out wrong. The length of each field is the biggest pain.
Putting a Select tool behind the input tool won't help, because the field is already shortened at the input.
Please fix this!
Maybe be able to change Type in the Metadata tab on 'Macro input'?
Please enhance the Join Multiple tool to include an option of:
"left outer join all on input 1".
Such a tool would be massively advantageous when data granularity is defined by one dataset (input 1) and many subsequent tables just need to be joined onto that input.
As-is, I have had to manually perform dozens of join + union sequences which seems both untidy and inefficient.
Such a feature would likely be more useful than existing options of full outer joins / inner joins which currently the tool allows.
I love the new (relatively) ConsumerView Decoder Tool! I used to do it the hard way, and it was fragile.
However, one thing is still missing: the Mosaic fields (MOSAIC HOUSEHOLD and MOSAIC ZIP4) - these are output from the tool as nulls. So, not only do you not get it decoded, you have to join back to the input to get the fields back as they were.
First, at least please pass them through as they were.
But preferably, decode them to the Mosaic Segment/Group names.
I realize (or couldn't find) the source for the Mosaic segment definitions is not currently in a Calgary database, but the tool is in the Calgary group.
Alteryx Gods,
Following a discussion with a person with whom I spend way too much time, @Jeff_Neklason , we were wondering would it be possible to allow users to drag and drop the position of the actual sections at the top of the designer?
Some users find they use the Developer section more than the Parse section, for example, and it would be beneficial if they could move the Developer section to the left to be more easily accessible.
Thank you Alteryx Gods.
I love you.
Kisses.
xxx
Hi all,
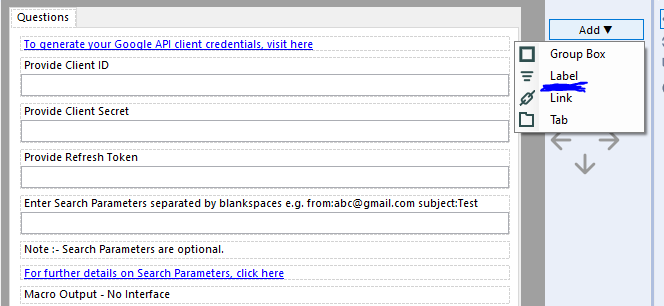
Is it possible to add an option to 'Add an Image' in the settings option of Interface Designer while building Apps or macros?
Currently, we can add Group box, Link, Tab, and Label. It would be really helpful if we can add static images as well!!
This would enable a developer to add an explanatory image just as a link or label is used to communicate to end user.
I am attaching a screenshot for the reference.

Thanks in advance!!
Regards,
Shreyansh Rathod
The ability to Sort and Filter in the Results window is a huge time saver. Please allow the same functionality when viewing results in a new window.
There are a fixed number of data types and I hate having to scroll through them when I set the data type in a Formula tool. Can the drop down expand into a window that shows them all at once? It doesn't take up that much real estate. They can even be grouped by type. I mocked it up in Excel.

I was able to add the following lines of R script to get the importance of the variables used in the cluster analysis. This will allow the user to see what variables are important in determining the clusters they have.
The script I added is below. It is pretty basic and could used spruced up by an Alteryx engineer as far as column naming, accounting for contingencies, and making it a reporting function. I think this would be a valuable feature for future versions of this tool.
library(FeatureImpCluster)#load library
FeatureImp_res <- FeatureImpCluster(clus.sol,as.data.table(the.matrix)) #Use FeatureImpCluster to take the cluster model (clus.sol) and data (the.matrix) to get variable imp.
FeatureImp_df <- as.data.frame(FeatureImp_res$featureImp) #turns features from a list to dataframe
FeatureImp_df_rn <- tibble::rownames_to_column(FeatureImp_df, "Variable") #Adds the variable name to the importance scores
write.Alteryx(FeatureImp_df_rn, 3) #outputs dataframe in output #3
I would like to see a pre-built visual flag or message/warning that shows if the join I made was cartesian or not.
To avoid cartesian joins I sometimes add a unique or summarize tool before the L or R inputs or add a message tool after the join.
If I don't do that then I sometimes calculate if the number of records in the L + C and L + R joins don't match up to the L and R input records.
It would be nice for Alteryx to be able to show some indication of if a cartesian join happened or not without having to add the extra tools or manual calculations
Something akin to Canvas>Connection Progress>Show Only When Running to be updated with the added functionality of Show with Cartesian Join Flags
Hi,
It would be great if users have the option to display the number of records that go in and out of the different tools in your canvas. This allows users to very quickly see how many records are in their datasets, and especially quickly analyze the results of specific actions such as joins, filters etc. without the need to open each individual tool. Especially when performing joins this can be very useful to quickly see how many of your rows have been successfully joined. I think this will give users a feeling that they have more control over their data and a better understanding of what is happening in Alteryx. Also if you quickly want to review a complex workflow (especially when it is not your own) this could be a huge timesaver. Simply run the workflow and follow the numbers to see what is happening and identify tools that might cause issues.
Love to hear what you think!

Hi Alteryx Team,
Now, Connect In-DB cannot use the data connection in gallery.
User need to input those DB info as well as the login and password.
I suggest to enhance the Connect In-DB tool, so that can select/use the gallery data connection.
From enterprise point of view:
1. No database credentials and connection properties be shared to designer user. It can reduce the risk from abnormal access.
2. Easy to manage the access control by Alteryx Admin in gallery. Can assign the data connections to different group of users. More convenience for audit.
3. Easy to maintain the data connection by Alteryx Admin in gallery. For example, reset the database password or update the connection properties .
On the other hand, it is better to setup in-DB data connection in gallery.
Best regards,
Samuel
The new enhancements to the Input tool, File, Excel file type being able to input a named range is fantastic!
One trick I use often when creating a template Excel file for user input is I give the form sheet a "Code Name" - sadly in Excel this cannot be set when creating the template using code or from Alteryx - it needs to be set manually in the <alt><F11> IDE, select the sheet in browser then set the code name in the properties window. Advantage: the user can change the visible label/name of the sheet to their liking but the code name does not change - therefore, an automated pipeline with a fixed sheet name for import (like a workflow picking up files dropped into a drop folder to ETL new results into a database), could reference the sheet code name and not be prone to workflow failure if the user changes the name of the sheet.
Please consider making the Count Record tool configurable so that users can receive a visual read of results in canvas. This would quickly assist in ensuring a user's ability to verify a workflow is functioning as expected or not. Currently there is no in canvas visual cue tied to the counter. If a user is expecting a certain count result (e.g. zero), the user has to click on the count records function to see if the result meets expectations or not. Users may spend a lot of time checking each stage of a workflow to ensure everything is flowing appropriately. A visual cue of results would reduce that time to check. Outside of runtime errors, there is currently no visual cue to indicate a possible problem or unexpected exception to a filter or other macro.
Two suggestions:
1) Allow users to color code count results in specific count results or ranges. (e.g. if a user is expecting a zero count, allow them to change the color of the counter to red for anything not resulting in zero and green if count is zero). Or allow them to set a color range depending on the count total (e.g. a user may need some visual tolerance indicator with a count under 100 as green, 101-200 as yellow, 201-300 as orange and 300+ as red).
2) Show the actual count in the Count Record macro icon.
Thank you!
It would be great to have an option in the Output Data tool to write the workflow name to the Info properties of Excel outputs.
Maybe something like this:

So that whenever you open an Excel file you always have a way of finding the name of the workflow that created the file.

This would make it so much easier as I often have to share Excel files with colleagues and customers and then need a way of tracking them back to workflows weeks or months later.
This might be something that people see as a feature, but if you've got an input tool on your canvas that isn't connected to anything, I'd like the engine (either) to ignore reading the data.
I often put tools onto the canvas and build around the input and in reality (or when working with large files), the execution is slower than it needs to be with reading files that are not used.
Cheers,
Mark
Many users will probably follow best practice style guides with Alteryx to use comment boxes under tools to describe in detail what is happening with these tools - such as this one shared by @BenMoss.
However a limitation of this is the comment boxes do not move with the tools, so if you have a well documented workflow but then need to add a new tool, you need to adjust all the spacing and re-align the tools, which with a large workflow can be time consuming.

Therefore the improvement would be to have an ability to lock comment boxes to individual tools (similar to a group function in Office).
When you download a workflow from the Alteryx Gallery to edit, the first typical step a user will take to debug is to run their workflow. This is potentially dangerous, as your user may not know what input data they are loading into what may be production data tables (as an example, when you are building apps you will typically have placeholder data in your inputs).
It would be great if the default option when editing a workflow stored on the gallery was that the 'Disable Tools that Write Output' button is checked, meaning people do not accidentally post incorrect information.
Ben
Can we have a tool to optimize another tool's configuration based on an output target? For example optimize the fuzzy logic setup to find the optimal tool configuration that yields the best matching score for a given data set.
- New Idea 275
- Accepting Votes 1,815
- Comments Requested 23
- Under Review 173
- Accepted 58
- Ongoing 6
- Coming Soon 19
- Implemented 483
- Not Planned 115
- Revisit 61
- Partner Dependent 4
- Inactive 672
-
Admin Settings
20 -
AMP Engine
27 -
API
11 -
API SDK
218 -
Category Address
13 -
Category Apps
113 -
Category Behavior Analysis
5 -
Category Calgary
21 -
Category Connectors
247 -
Category Data Investigation
77 -
Category Demographic Analysis
2 -
Category Developer
208 -
Category Documentation
80 -
Category In Database
214 -
Category Input Output
641 -
Category Interface
240 -
Category Join
103 -
Category Machine Learning
3 -
Category Macros
153 -
Category Parse
76 -
Category Predictive
77 -
Category Preparation
394 -
Category Prescriptive
1 -
Category Reporting
198 -
Category Spatial
81 -
Category Text Mining
23 -
Category Time Series
22 -
Category Transform
89 -
Configuration
1 -
Content
1 -
Data Connectors
964 -
Data Products
2 -
Desktop Experience
1,538 -
Documentation
64 -
Engine
126 -
Enhancement
331 -
Feature Request
213 -
General
307 -
General Suggestion
6 -
Insights Dataset
2 -
Installation
24 -
Licenses and Activation
15 -
Licensing
12 -
Localization
8 -
Location Intelligence
80 -
Machine Learning
13 -
My Alteryx
1 -
New Request
194 -
New Tool
32 -
Permissions
1 -
Runtime
28 -
Scheduler
23 -
SDK
10 -
Setup & Configuration
58 -
Tool Improvement
210 -
User Experience Design
165 -
User Settings
80 -
UX
223 -
XML
7
- « Previous
- Next »
-
 NicoleJ
on:
Disable mouse wheel interactions for unexpanded dr...
NicoleJ
on:
Disable mouse wheel interactions for unexpanded dr...
- TUSHAR050392 on: Read an Open Excel file through Input/Dynamic Inpu...
- NeoInfiniTech on: Extended Concatenate Functionality for Cross Tab T...
- AudreyMcPfe on: Overhaul Management of Server Connections
-
AlteryxIdeasTea
m on: Expression Editors: Quality of life update - StarTrader on: Allow for the ability to turn off annotations on a...
- simonaubert_bd on: Download tool : load a request from postman/bruno ...
- rpeswar98 on: Alternative approach to Chained Apps : Ability to ...
-
 caltang
on:
Identify Indent Level
caltang
on:
Identify Indent Level
- simonaubert_bd on: OpenAI connector : ability to choose a non-default...
| User | Likes Count |
|---|---|
| 20 | |
| 9 | |
| 6 | |
| 6 | |
| 5 |