Alteryx Designer Desktop Ideas
Share your Designer Desktop product ideas - we're listening!Submitting an Idea?
Be sure to review our Idea Submission Guidelines for more information!
Submission Guidelines- Community
- :
- Community
- :
- Participate
- :
- Ideas
- :
- Designer Desktop: Top Ideas
Featured Ideas
Hello,
After used the new "Image Recognition Tool" a few days, I think you could improve it :
> by adding the dimensional constraints in front of each of the pre-trained models,
> by adding a true tool to divide the training data correctly (in order to have an equivalent number of images for each of the labels)
> at least, allow the tool to use black & white images (I wanted to test it on the MNIST, but the tool tells me that it necessarily needs RGB images) ?
Question : do you in the future allow the user to choose between CPU or GPU usage ?
In any case, thank you again for this new tool, it is certainly perfectible, but very simple to use, and I sincerely think that it will allow a greater number of people to understand the many use cases made possible thanks to image recognition.
Thank you again
Kévin VANCAPPEL (France ;-))
Thank you again.
Kévin VANCAPPEL
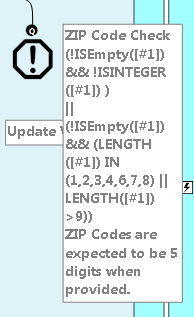
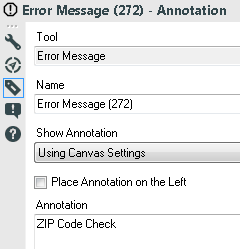
For example I have an ERROR MESSAGE tool that is rather verbose. I chose to modify the annotation as: ZIP Code Check. I presumed that the result would simply be "ZIP Code Check", but Alteryx added that to the beginning of the annotation rather than replacing the whole annotation. I reported this as a bug, but was told that this was designed to operate in this manner. It was suggested that I bring this out as a "New Idea" to the community for review. If you agree that the tools should operate in a similar fashion for annotation (or other actions) across the pallet, please STAR this. Otherwise, I'm happy to hear your feedback.
Thanks,
Mark
In some cases, the information about incoming columns to tools are (temporarily) forgotten, e.g. if Autoconfig is switched off, if the incoming connection is temporarily missing, or if column names are generated dynamically and the workflow has not been executed, yet.
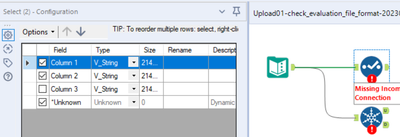
Many tools deal with that situation well, e.g. Selection, Formula, or Summarize. In these cases, the tools tell the user that they cannot find incoming columns, but they preserve the configuration so that the user still can (at least partially) work on these tools and important information on the configuration is not lost:
Example Select Tool
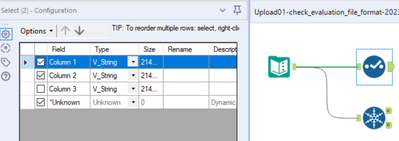
- First step: Connections present, configuration typed in:
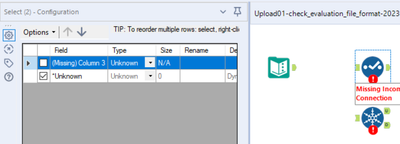
- Second step: Connection cut, confguration opened. The configuration looks screwed up but implicitly contains all settings:
- Third step: Connection re-connected. The configuration is as before:
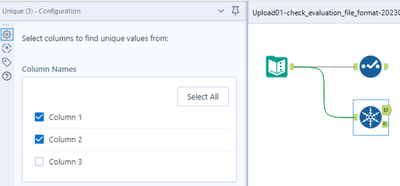
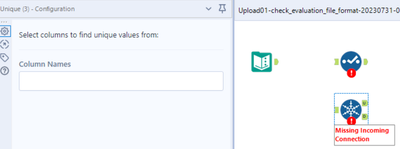
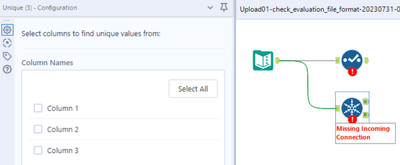
Other tools behave the opposite, for example Unique or Macro Input (an for sure many other tools). If the incoming columns are currently unknown to the Designer and you click once on the symbol, the entire configuration of this tool is lost. You might try to get the configuration back by pressing undo. This, in most cases does not work. Or, even worse, you find out what happened later when it's too late for undo. In this case, you either have an old version of that workflow to look up the configuration or you have to re-develop it. In any case, this is unnecessary and time-consuming software behaviour.
Example Unique Tool
- Step 1: Connections present, configuration typed in:
- Step 2: Connection cut, confguration opened. The configuration is empty:
- Step 3: Connection re-connected: The entire configuration is permanently lost:
I wasn't sure whether I should report this as a bug or a feature enhancement. It is somehow in between. Two aspects tell me that this should be changed:
- Inconsistent behaviour of different tools for now reason,
- Easy loss of programming work, resulting in time-consuming bug fixing.
Please make sure that all tools preserve their configuration also if information on incoming columns is temporarily lost.
When making any type of macro, it's important to test the functionality of the macro via a debug. This is accomplished successfully with normal tools, however there's a bug that will not allow the user to debug In-DB macros that use either of the following standard Alteryx tools:
- Macro Input In-DB
- Macro Output In-DB
If either of these tools are included in the macro you are building, an error message will appear not allowing you to open a debug.
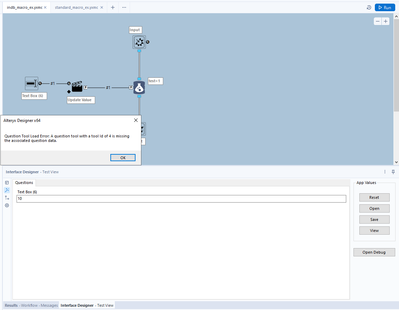
Error message: Question Tool Load Error: A question tool with a tool id of XXX is missing the associated question data.
Of course, Macro input and output tools do not require any specific action/question tool associated with it. This is a bug. A user pointed out the XML issue almost 3 years ago here:
In summary: "It appears that the tool itself inserts a hidden Question attribute into the XML which can also be seen in Workflow Configuration"
Source:
Examples....
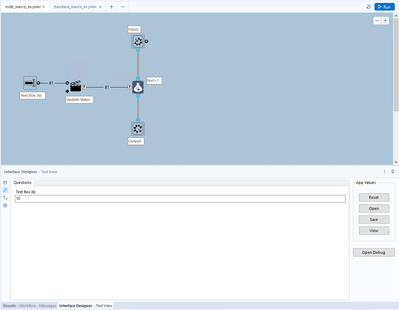
A normal macro, using standard tools:
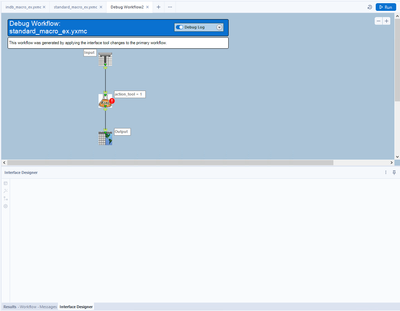
After debugging a standard macro, the Macro Input/Output tools correctly change to a Text Input and a Browse tool. This allows the macro author to test the macro.
However, when trying the same thing with In-DB tools in a macro, an error message appears:
In-DB macro 1:
In-DB Macro error message (after clicking "Open Debug"):
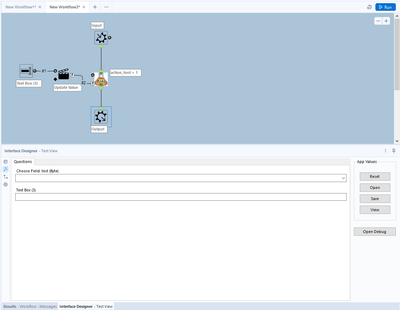
I often use user constants in my workflows and ever since the Workflow tab has been buried under the Canvas tab in the Workflow Configuration, I often forget to adjust my constants. Out of sight, out of mind.
My suggestion would be to create a tool that could be placed on the canvas with the constant name in the title area and a text box which shows the current value and allows the user to change the value before processing.
Allow for setting universal DATA SIZE configuration. ESPECIALLY on V_WString!! If you want all your V_WString to be 5096, you can set it. If you want all your fixed decimal values to be 12.4 you can set that. You can set your own values for a workflow or under advanced setting perhaps you set up your own default values that will be used across all work flows.
At MINIMUM, change the 1,073,741,823 on V_WString to something semi reasonable. That size won't even fit in a Snowflake table.
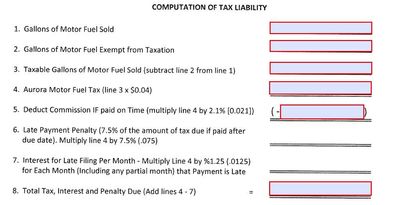
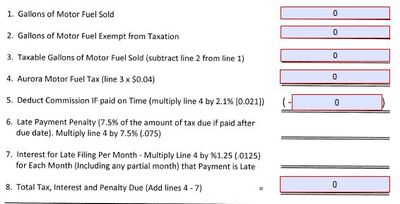
One additional output that would be very useful is to enable output values to be placed into a PDF that has pre-defined fields that can be created by using the Forms tool in Adobe Acrobat. Our company uses Alteryx to prepare information that will be used in tax returns. Currently, the data that gets outputted, is then manually entered into PDF fields but I think there is an opportunity to have Alteryx do this for us. See the pictures below, I can create forms that can be defined as "Text1", and then my idea is to tell Alteryx that one specific field value, should be put into the PDF form "Text1".
Hello all,
Change Data Capture ( https://en.wikipedia.org/wiki/Change_data_capture ) is an effective way to deal with changes in a database, allowing streaming or delta functionning. Several technos, more or less intrusive, can be applied (and combined). Ex : logs reading.
Qlik : https://www.qlik.com/us/streaming-data/data-streaming-cdc
Talend : https://www.talend.com/resources/change-data-capture/
Best regards,
Simon
In Japan, the prople usually use the date format "yyyy/mm/dd". But there is no preset in Date tool. So I usually use custom setting, but it is the waste of time.
So please add yyyy/mm/dd format to the preset in Date tool configuration for Japanese people.
It is my understanding that hidden in each yxdb is metadata. The following use case is common:
As an Alteryx Developer/Designer I want to know the source of a yxdb.
Ideally, I would know as much about the workflow (name, path, workflow version, AYX version, userid) as possible.
It would be awesome to be construct a workflow that would allow me to search the metadata of yxdb's on my client computers quickly.
Cheers,
Mark
A few suggestions that I think can improve the Sharepoint Files Output Tool:
- Maybe I'm missing it, but I cannot see how you can delete a file from the output list once you've added it:
- Have the write headers output checkbox ticked by default as I expect this is the more common expectation:
- Take the file extension by default based on the users selection in the Options tab as I shouldn't have to write .xlsx for the extension:
Analytical apps currently do not have the ability to provide any indication of progress to users when hosted on the galaxy.
It would be valuable to be able to provide a progress bar or some indication of progress to the user when invoking analytical apps from the gallery.
I have need to Unique my data on all fields. However, I do not know all the fields that will be in my data because of a Dynamic Select tool (or in some cases a Cross Tab tool). The Unique tool defaults to having any new fields be unchecked in its configuration. Without finding some work around, I will be unable to schedule this workflow or turn it into an app for use on the Gallery without risking duplication caused by the Unique tool that fails to capture new/different fields that may come through the data.
To solve this problem and be consistent with other tools in Alteryx, the following features need to be added to the Unique tool:
- The user should be able to check a "Dynamic or Unknown Fields" option that will enable Alteryx to include any new fields in the data as part of the Unique (or any fields that have their names changed).
- If a field that was checked in the Unique tool before no longer exists, it should appear yellow (like the missing fields in the Select tool) and produce a warning in the Results window. The option to "Forget all missing fields" will also need to be added.
There needs to be a way to step into macro a which is component of parent workflow for debugging.
Currently the only way to achieve to debug these is to capture the inputs to the macro from the parent workflow, and then run the amend inputs on the macro. For iterative / batch macros, there is no option to debug at all. This can be tedious, especially if there are a number of inputs, large amounts of data, or you are have nested macros.
There should be an option on the tool representing the macro in the parent workflow to trigger a Debug when running the workflow, this would result in the same behavior when choosing 'Debug' from the interface panel in the macro itself: a new 'debug' workflow is created with the inputs received from the parent workflow.
On iterative / batch macros, which iteration / control parameter value the debug will be triggered on should be required. So if a macro returns an error on the 3 iteration, then the user ticks 'Debug' and Iteration = 3. If it doesn't reach the 3rd iteration, then no debug workflow is created.
We aren't getting a huge amount of help from support on this, so I'm posting this idea to raise awareness for the product teams responsible for the Salesforce connectors and the embedded Python environment.
This post from user Dubya describes the issue in detail:
I have a workflow with several salesforce tools in it, which works fine on my machine. But we need another alteryx user in our office to be able to access, run and maintain the workflow too, via their machine and copy of alteryx designer.
However we're finding that the salesforce inputs and outputs can only be authenticated on one machine at a time.
When the other new user opens the original workflow from the shared network location, the salesforce tools display an error "Salesforce Input (1): {'error': 'invalid_grant', 'error_description': 'authentication failure'}" and the tools fail to load any data. But we can see the full query in the tool and we can even set the custom query option and validate the query successfully, which suggests the source is being correctly connected to and queried, but we just cant run the tool.
The only way to run the tool successfully is to change the credentials and re-authenticate the tool. However this then de-authenticates the original machine, and when we open up the workflow on there and try to run ying the workflow brings back the same error.
We've both tried this authentication back and forth on our own machines and each time one of us re-authenticates, it de-authenticates the other, leading to it triggering the error.
Can someone help explain what's going on and how to fix it, as this doesn't bode well for our collaboration.
We're both running:
The latest build of version of designer 2021.2 (original machine also running desktop automation)
Salesforce Input Tool v4.1.0
Salesforce Output Tool v1.3.0
My response here identifies that this is a problem for our organization as well:
We're experiencing the same issue. It appears to be related to how the tool handles password and security token decryption. I've found that when you modify the related registry entry from "true" to "false", you can see in the tool's xml that the encrypted password and security token are still in there. I'm not sure what else is going on behind the scenes beyond that, but that ought to be addressable by the product teams handling the Salesforce connectors and the Python installation embedded in Designer.
The only differences in our environment compared to u/Dubya's are that we're running on 2020.4 and attempting to use Salesforce Input Tool v4.2.4.
This is a must have for anyone who needs the ability to share workflows among multiple users. This is part of a series of problems that these updated connectors have been plagued with since introducing them years ago, and no one at Alteryx seems to care enough to truly fix the problems. Salesforce is a core system for our organization, so having tools that utilize the latest version of Salesforce's APIs is very important to us. The additional features that the Input tool provides are welcome, but these bugs have to be sorted out in order for us to extract any kind of value out of them. If the "deprecated" Salesforce tools were ever to be removed from Designer while there are issues with the "new" connectors, we would have no choice other than to never upgrade Designer/Server again and be forced to look for another product to serve as our ETL platform.
Please, please, please address this.
I want to jump to expression #3 of formula (3), when I see following error message. Now I can jump to formula (3), but only expression #1 is opened, not #3. If I have 30 expressions, it is hard to find #20 in 30s.
When building API calls within Alteryx there are a few common steps required
1) Build out the URI for the API call (base URL plus any query parameters)
2) Deal with authentication, such as basic authentication requires taking a key and secret, base 64 encoding and passing this into the tool
3) parsing the results out and processing these downstream
For this idea I am specifically focusing on step 3 (but it would be great to have common authentication methods in-built within the download tool (step 2)!).
There are common steps required to parse out the results, such as using Filter (to check for a 200 response), JSON parse, text to columns and then cross tab to get the results into a readable format. These will all be common steps anyone who has worked with APIs will be familiar with:
This is all fine for a regular user to quickly add in and configure these tools. However there is no validation here for the JSON result being as expected, which when embedding an API into a batch macro or analytic app means it can easily fail.
One example of a failure which I've recently come across is where the output JSON doesn't have all fields (name:value pairs) depending the json response. For example using the UK Companies House API, when looking at the ceased to act field at this endpoint - https://developer-specs.company-information.service.gov.uk/companies-house-public-data-api/resources... the ceased to act field only appears in the results if a person has actually ceased to act. This is important if you have downstream tools such as a formula to create a field [Active] where you have:
IF ISNull([ceased_to_act]) THEN "Active" ELSE "Ceased to Act" ENDIFHowever without modification the macro / app will error if any results are returned where there is not this field.
A workaround is to add in the Crew Ensure Fields or union on a list of fields, to ensure that the Cease to Act field is present in the output for all API calls. But looking at some other tools it would be good if an expected Schema could be built in to the download tool to do this automatically.
For example in Power Automate this is achieved as follows:
I am a big advocate of not making things unnecessarily complicated. Therefore I would categorise this as an ease of use feature to improve the experience of working with APIs within Alteryx and make APIs (as load of integrations are API based) accessible to as many users as possible.
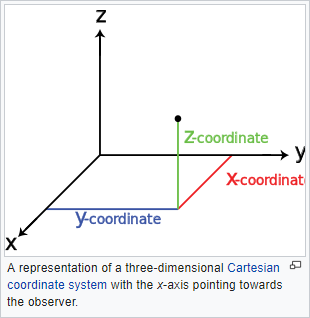
Let's "Elevate" Alteryx to enter the Euclidean space and add the Z-Coordinates to our spatial tools!
Cleanse Macro
Given a choice between the delivered macro and the CReW macro, I’ll choose the CReW macro for both speed and functionality. Wikipedia says, “Data cleansing or data cleaning is the process of detecting and correcting (or removing) corrupt or inaccurate records from a record set, table, or database and refers to identifying incomplete, incorrect, inaccurate or irrelevant parts of the data and then replacing, modifying, or deleting the dirty or coarse data.” If Alteryx were to convert the macro to a true tool, here is my feature request list:
Performance:
- AMP compatible – Fast!
- Faster than the CReW macro for deleting empty fields/rows
- Resolve time it takes to load the tool (current macro versions are slow), html is faster.
Feature Enhancement:
- Allow selection of fields based on data type
- Include incoming/outgoing SELECT functionality
- Allow for PREFIX functionality (like multi-field formula), but NOT default
- Read incoming metadata to provide color coding of fields to indicate where potential problems exist (e.g. NULL, Whitespace) – part of browse everywhere currently
- Allow for Nulls to convert to 0/blank or 0/blank to convert to Null
- When removing punctuation, provide for exceptions (e.g. Numeric set of negative, comma and period).
- Include HTML tag removal
- Support internationalization (character sets)
Going the extra mile:
- Display or opt for output, cleanup metrics. How dirty was my data? Potentially, allow for ERROR to stop workflow if garbage is detected.
- Optional: Detect outliers in numeric data. I’ve got an outlier detection macro that we can review, but while you are passing all of the data for numeric values, explaining or tagging outliers would be useful. Could be a box-whisker on numeric values maybe?
- Make outlier actionable
- Identify in data (new field indicator)
- Remove
- Modify/Impute
- Test/Preview against metadata: (pre-run), see what the incoming/outgoing results would be on *all of the metadata before I run the workflow.
- camelCase: https://en.wikipedia.org/wiki/Camel_case
- Identify/Replace unknown values (e.g. N/A, Not Applicable, #) with Null() or other?
- Identify/Remove duplicate values within a cell
- See also: https://en.wikipedia.org/wiki/Data_cleansing
- Option to point to a “personal” dictionary for spelling or validation
- Provide “smart” annotation on tool
- Make outlier actionable
Added in Alteryx Version 2020.3, the Browse tool no longer shows a profile of the complete dataset (it is capped when the record data size reached 300MB).
My proposed solution is an optional override of the record size limit on the browse tool (which will make the profiling take longer, but actually profile the entire dataset). I would also like a general user setting to set the default behavior of the browse tool to either be limited or unlimited.
Below is the newly included documentation of the Data Profiling Limit, which I'm proposing can be overridden.
Data Profiling Limit
Data Profiling in the Browse tool is capped at 300 MB. This allows you to process very large datasets faster. For each record in the incoming dataset, we process the record and add the record size to a counter. Once the counter reaches 300 MB, we stop processing records.

It is important to note that there is no specific number of records that we can process. This depends on the dataset since a record size can range from 1 byte to a few thousand bytes. This record size is different from the file size, displayed in the Results grid and Data Profiling Holistic View. The file size is generally different since it has been compressed to optimize spacing.

In other words, 300 MB of record size is not the same as 300 MB of file size.
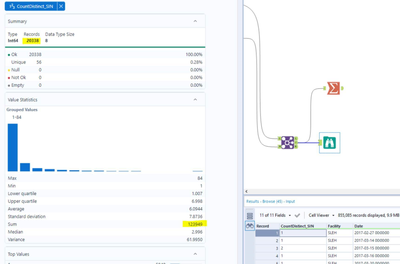
This new tool can cause confusion when looking at the data profile (e.g. if you expect the sum to be $3 million, but the browse tool is only showing 2% of your total records in the profile tool, the profile sum may only show $60 thousand).
The sampled version with a cutoff of 300MB is rarely useful if you are using browse tools to get a quick sense of the variable profiles on medium sized datasets (around 1 million records) since this rarely will fit into the 300MB record size limit.
An example can be shown in the image below, where the dataset contains 855,085 records, but the browse tool is profiling only the first 20,338.
Again, being able to override this 300MB record size limit would fix the problem created in the 2020.3 change to the browse tool.
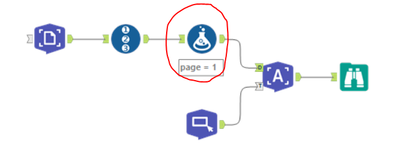
When using the text mining tools, I have found that the behaviour of using a template only applies to documents with the same page number.
So in my use case I've got a PDF file with 100+ claim statements which are all laid out the same (one page per statement). When setting up the template I used one page to set the annotations, and then input this into the T anchor of the Image to Text tool. Into the D anchor of this tool is my PDF document with 100+ pages. However when examining the output I only get results for page 1.
On examining the JSON for the template I can see that there is reference to the template page number:
And playing around with a generate rows tool and formula to replace the page number with pages 1 - 100 in the JSON doesn't work. I then discovered that if I change the page number on the image input side then I get the desired results.
However an improvement to the tool, as I suspect this is a common use case for the image to text tool, is to add an option in the configuration of the image to text tool to apply the same template to all pages.
- New Idea 258
- Accepting Votes 1,818
- Comments Requested 24
- Under Review 169
- Accepted 56
- Ongoing 5
- Coming Soon 11
- Implemented 481
- Not Planned 118
- Revisit 64
- Partner Dependent 4
- Inactive 674
-
Admin Settings
20 -
AMP Engine
27 -
API
11 -
API SDK
218 -
Category Address
13 -
Category Apps
112 -
Category Behavior Analysis
5 -
Category Calgary
21 -
Category Connectors
245 -
Category Data Investigation
76 -
Category Demographic Analysis
2 -
Category Developer
208 -
Category Documentation
80 -
Category In Database
214 -
Category Input Output
636 -
Category Interface
238 -
Category Join
102 -
Category Machine Learning
3 -
Category Macros
153 -
Category Parse
76 -
Category Predictive
77 -
Category Preparation
392 -
Category Prescriptive
1 -
Category Reporting
198 -
Category Spatial
81 -
Category Text Mining
23 -
Category Time Series
22 -
Category Transform
87 -
Configuration
1 -
Data Connectors
958 -
Data Products
3 -
Desktop Experience
1,525 -
Documentation
64 -
Engine
125 -
Enhancement
316 -
Feature Request
212 -
General
307 -
General Suggestion
4 -
Insights Dataset
2 -
Installation
24 -
Licenses and Activation
15 -
Licensing
12 -
Localization
8 -
Location Intelligence
80 -
Machine Learning
13 -
New Request
188 -
New Tool
32 -
Permissions
1 -
Runtime
28 -
Scheduler
24 -
SDK
10 -
Setup & Configuration
58 -
Tool Improvement
210 -
User Experience Design
165 -
User Settings
78 -
UX
223 -
XML
7
- « Previous
- Next »
- rpeswar98 on: Alternative approach to Chained Apps : Ability to ...
-
caltang on: Identify Indent Level
- simonaubert_bd on: OpenAI connector : ability to choose a non-default...
- maryjdavies on: Lock & Unlock Workflows with Password
- nzp1 on: Easy button to convert Containers to Control Conta...
-
Qiu on: Features to know the version of Alteryx Designer D...
- DataNath on: Update Render to allow Excel Sheet Naming
- aatalai on: Applying a PCA model to new data
- charlieepes on: Multi-Fill Tool
- seven on: Turn Off / Ignore Warnings from Parse Tools
| User | Likes Count |
|---|---|
| 27 | |
| 12 | |
| 11 | |
| 7 | |
| 6 |
