Alteryx Designer Desktop Ideas
Share your Designer Desktop product ideas - we're listening!Submitting an Idea?
Be sure to review our Idea Submission Guidelines for more information!
Submission Guidelines- Community
- :
- Community
- :
- Participate
- :
- Ideas
- :
- Designer Desktop
Featured Ideas
Hello,
After used the new "Image Recognition Tool" a few days, I think you could improve it :
> by adding the dimensional constraints in front of each of the pre-trained models,
> by adding a true tool to divide the training data correctly (in order to have an equivalent number of images for each of the labels)
> at least, allow the tool to use black & white images (I wanted to test it on the MNIST, but the tool tells me that it necessarily needs RGB images) ?
Question : do you in the future allow the user to choose between CPU or GPU usage ?
In any case, thank you again for this new tool, it is certainly perfectible, but very simple to use, and I sincerely think that it will allow a greater number of people to understand the many use cases made possible thanks to image recognition.
Thank you again
Kévin VANCAPPEL (France ;-))
Thank you again.
Kévin VANCAPPEL
Hi all,
https://community.alteryx.com/t5/Alteryx-Knowledge-Base/Tool-Mastery-RegEx/tac-p/74936
@AlexKo did an excellent article on RegEx, and Mark @MarqueeCrew Frisch has helped me out of many pickles with Regex - and one of the things that I've discussed with a few folk on the community is that Regex is super-powerful ( @Ken_Black made this same comment) and can do way more than we initially understand.
The problem is not one of the power of the tool, but rather the onramp to using it (it's painful to do/experiment/run/try etc, it doesn't give you any visual guides or hints when you've got it right or wrong, etc)
My method is to hop straight on to http://regex101, paste in sample text, and figure out the right RegEx in their AWESOME UI which really make this into a 5 minute job, and makes me feel like I've scored at least one victory today (it is so easy, you actually feel more powerful and competent).
Could we bring some of this great User Interaction design into the RegEx tool? I honestly believe that if the RegEx tool was as easy and approachable as RegEx101.com (or why not go one better than them), we'd see an explosion in usage and creativity.
Thank you all
Sean
There is an extensive need from customers to be able to create emails but not send them (right away at least).
I'm in the banking sector and I have been seeing many banks using Alteryx and Alteryx server in their routines. Also, when it comes to sending automatic e-mails in this sector, its very risky. We need a "four eyes check" when dealing with clients information. Currently there is no workaround that could be applied to e-mail tool when used in Alteryx server as well.
My idea is to simply create a button "Save in draft" in e-mail tool to create an .eml format as output. This .eml can be read by outlook and thus, it creates a draft.
This also should be taken into account when dealing with drafts in alteryx server, so that any user can run the workflow and get the desired draft.
Thanks
When creating a connection using DCM (example being ODBC for SQL) - the process requires an ODBC Data Source Name (see screenshot 1 below).
However, when you use the alias manager (another way to make database connections) - this does allow for DSN-free connections which are essential for large enterprises (see screenshot 2 below).
NOTE: the connection manager screens do have another option - Quick Connect - which seems to allow for DSN-free connections, but this is non-intuitive; and you're asked to type in the name of the driver yourself which seems to be an obvious failure point (especially since the list of all installed drivers can be read straight from the registry)
Please could we change DCM to use the same interfaces / concepts as the alias screens so that all DCM connections can easily be created without requiring an ODBC DSN; and so that DSN-free connections are the default mode of operation?
Screenshot 1: DCM connection:
screenshot 2
cc: @wesley-siu @_PavelP @ToddTarney
I noticed through the ODBC driver log that Alteryx doesn't care about the kind of base I precise. It tests every single kind of base to find the good one and THEN applies the queries to get the metadata info.
Here an example. I have chosen an Hive in db connection. If I read the simba logs, i can find those lines :
Mar 01 11:37:21.318 INFO  5264 HardyDataEngine::Prepare: Incoming SQL: select USER(), APPLICATION_ID() from system.iota

Mar 01 11:37:22.863 INFO  5264 HardyDataEngine::Prepare: Incoming SQL: select USER as USER_NAME from SYSIBM.SYSDUMMY1

Mar 01 11:37:23.454 INFO  5264 HardyDataEngine::Prepare: Incoming SQL: select * from rdb$relations

Mar 01 11:37:23.546 INFO  5264 HardyDataEngine::Prepare: Incoming SQL: select first 1 dbinfo('version', 'full') from systables

Mar 01 11:37:23.707 INFO  5264 HardyDataEngine::Prepare: Incoming SQL: select #01/01/01# as AccessDate

Mar 01 11:37:23.868 INFO  5264 HardyDataEngine::Prepare: Incoming SQL: exec sp_server_info 1

Mar 01 11:37:24.093 INFO  5264 HardyDataEngine::Prepare: Incoming SQL: select top (0) * from INFORMATION_SCHEMA.INDEXES

Mar 01 11:37:24.219 INFO  5264 HardyDataEngine::Prepare: Incoming SQL: SELECT  SERVERPROPERTY('edition')

Mar 01 11:37:24.423 INFO  5264 HardyDataEngine::Prepare: Incoming SQL: select DATABASE() as `database`, VERSION() as `version`

Mar 01 11:37:24.635 INFO  5264 HardyDataEngine::Prepare: Incoming SQL: select * from sys.V_$VERSION at where RowNum<2

Mar 01 11:37:25.230 INFO  5264 HardyDataEngine::Prepare: Incoming SQL: select cast(version() as char(10)), (select 1 from pg_catalog.pg_class) as t

Mar 01 11:37:25.415 INFO  5264 HardyDataEngine::Prepare: Incoming SQL: select NAME from sqlite_master

Mar 01 11:37:25.756 INFO  5264 HardyDataEngine::Prepare: Incoming SQL: select xp_msver('CompanyName')

Mar 01 11:37:26.156 INFO  5264 HardyDataEngine::Prepare: Incoming SQL: select @@version

Mar 01 11:37:26.376 INFO  5264 HardyDataEngine::Prepare: Incoming SQL: select * from dbc.dbcinfo

Mar 01 11:37:26.522 INFO  5264 HardyDataEngine::Prepare: Incoming SQL: SELECT @@VERSION;
I can understand that when Alteryx doesn't know the kind of base he tries everything.. (eg : in memory visual query builder) but here, I have selected the Hive database and I have to loose more than 5 seconds for nothing.
Hi Alteryx community,
It would be really nice to have v_string/v_wstring and max character size as a standard for text columns.
it is countless how many times I found that the error was related to a string truncation due to string size limit from the text input.
Thumbs-up those who lost their minds after discovering that the error was that! 😄
I love Workflow Meta info, especially the ability to put the Author, the search tags,the version, the description, etc...
But why can't we use it as Engine Constant? It doesn't seem very hard to implement and it would change life for development.
Hello all,
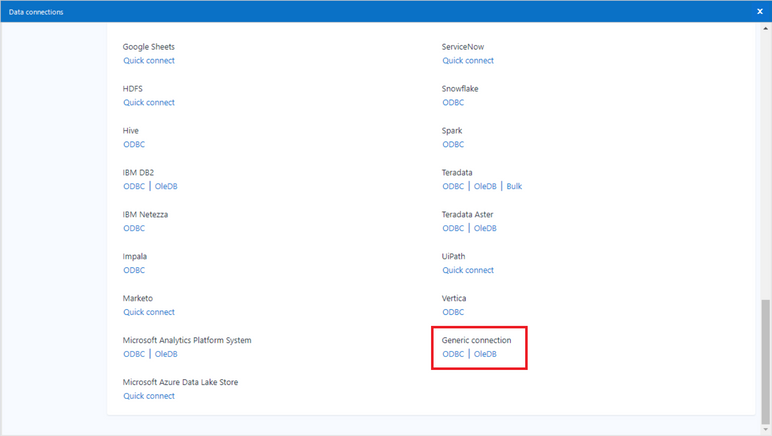
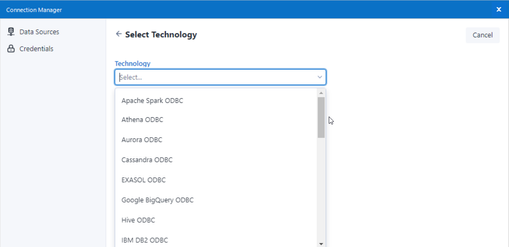
I really love the DCM feature present in the last two releases. However, I have noticed the Generic ODBC Connection is missing :
Classic Connection Manager :
Data Connection Manager :
Best regards,
Simon
At our organization we are required to change our passwords every few months forcing a change to my Tableau Server password. How does this relate to Alteryx? Well, every 90 days I have to change my password in the "Publish to Tableau Server Tool" for all of my workflows. This is quite a cumbersome process that could be eliminated with AD.
If you dislike manually changing your for each workflow that uses this tool then "star" this post!
In Japan, the prople usually use the date format "yyyy/mm/dd". But there is no preset in Date tool. So I usually use custom setting, but it is the waste of time.
So please add yyyy/mm/dd format to the preset in Date tool configuration for Japanese people.
In order to make the connections between Alteryx and Snowflake even more secure we would like to have the possibility to connect to snowflake with OAuth in an easier way.
The connections to snowflake via OAuth are very similar to the connections Alteryx already does with O365 applications. It requires:
- Tenant URL
- Client ID
- Client Secret
- Get Authorization token provided by the snowflake authorization endpoint.
- Give access consent (a browser popup will appear)
- With the Authorization Code, the client ID and the Client Secret make a call to retrieve the Refresh Token and TTL information for the tokens
- Get the Access Token every time it expires
With this an automated workflow using OAuth between Alteryx and Snowflake will be possible.
You can find a more detailed explanation in the attached document.
It would be helpful to be able to filter within the results window of a Browse tool for all "Not OK" records (records with leading/trailing spaces, embedded newlines, etc.) I can already filter for null and empty values, but this would be helpful for cleaning up data. I want to see the "dirty" data before taking out leading/trailing spaces or embedded new lines to see if there is something I'm missing in the data that needs to be further parsed or modified.
When you use Create Points tool - you then almost always need to use a Select tool to rename that point.
Can we please add a single text field to the Create Points tool - which would then allow us to create and name a point in one step?
Hello,
As I mentioned in this previous idea : https://community.alteryx.com/t5/Alteryx-Designer-Ideas/Generic-In-database-connection-please-stop-i...
field mapping in generic in-db connection is based on Microsoft Sql Server. Given the specificity of MSQL Server field types, I would like to change that in order to at least be able to use another database. Without that, this feature has no sense at all.
Best regards,
Simon
Two very useful functions
According to https://www.w3schools.com/sql/func_mysql_least.asp
The LEAST() function returns the smallest value of the list of arguments.
example : SELECT LEAST("w3Schools.com", "microsoft.com", "apple.com");
returns "apple.com"
GREATEST works exactly the same but returns the greatest value of the list of argument
As of today, Alteryx proposes max and min to deal with that, but it only works with number and , I think, it's an ambiguous syntax : Max and Min works both as an aggregation function and as a row function. I love to separate these two notions.
Having a more standard means also more interoperability.
On a related topic, the coalesce function is proposed here : https://community.alteryx.com/t5/Alteryx-Designer-Ideas/Coalesce-function/idi-p/841014
Best regards,
Simon
We have lots of tools that create new column(s) from the Inputs, e.g., Generate Rows. It'd be very nice if the new column(s) is/are highlighted in the Output. This makes it a lot easier for users when developing the workflow.
95% of the times I see myself using the Directory Tool, it is only to access the FullPath content, so I immediatly add a Select tool to deselect the other attributes the tool returns.
Is there any chance to add a checkbox to only retrieve FullPath?
I couldn't find a previous idea on this, but let me know if it already exists.
It would be great to have an option in the Output Data tool to write the workflow name to the Info properties of Excel outputs.
Maybe something like this:
So that whenever you open an Excel file you always have a way of finding the name of the workflow that created the file.
This would make it so much easier as I often have to share Excel files with colleagues and customers and then need a way of tracking them back to workflows weeks or months later.
Hello!
Currently i develop on a 2560 x 1440 monitor, and it is great for development of Alteryx workflows.
However, from an accessibility perspective (and for demonstration purposes), the whole of the Alteryx Interface text and icons are far too small for anyone to read. For instance, this is what Designer looks like at the most common monitor size, 1920 x 1080:
And at my native resolution (2560 x 1440)
And 4k resolution, for comparison:
As you will notice - virtually everything is smaller, and unreadable at higher resolutions. It doesn't appear that this is a setting within Alteryx, and so I have to resort to windows settings to change the size:
Or as @CharlieS mentions here change the size of text across all applications.
It would be useful within Alteryx to have a 'scaling' slider/dropdown, so I do not have to change the resolution or size of applications within windows, to be able to easy read or demonstrate data from Alteryx Designer.
Thanks,
TheOC
Alteryx has the ability to connect to data sources using fat clients and ODBC but not JDBC. If the ability to use JDBC could be added to the product it could remove the need to install fat clients.
- New Idea 376
- Accepting Votes 1.784
- Comments Requested 21
- Under Review 178
- Accepted 47
- Ongoing 7
- Coming Soon 13
- Implemented 550
- Not Planned 107
- Revisit 56
- Partner Dependent 3
- Inactive 674
-
Admin Settings
22 -
AMP Engine
27 -
API
11 -
API SDK
228 -
Category Address
13 -
Category Apps
114 -
Category Behavior Analysis
5 -
Category Calgary
21 -
Category Connectors
252 -
Category Data Investigation
79 -
Category Demographic Analysis
3 -
Category Developer
217 -
Category Documentation
82 -
Category In Database
215 -
Category Input Output
655 -
Category Interface
246 -
Category Join
108 -
Category Machine Learning
3 -
Category Macros
155 -
Category Parse
78 -
Category Predictive
79 -
Category Preparation
402 -
Category Prescriptive
2 -
Category Reporting
204 -
Category Spatial
83 -
Category Text Mining
23 -
Category Time Series
24 -
Category Transform
92 -
Configuration
1 -
Content
2 -
Data Connectors
982 -
Data Products
4 -
Desktop Experience
1.604 -
Documentation
64 -
Engine
134 -
Enhancement
406 -
Event
1 -
Feature Request
218 -
General
307 -
General Suggestion
8 -
Insights Dataset
2 -
Installation
26 -
Licenses and Activation
15 -
Licensing
15 -
Localization
8 -
Location Intelligence
82 -
Machine Learning
13 -
My Alteryx
1 -
New Request
226 -
New Tool
32 -
Permissions
1 -
Runtime
28 -
Scheduler
26 -
SDK
10 -
Setup & Configuration
58 -
Tool Improvement
210 -
User Experience Design
165 -
User Settings
85 -
UX
227 -
XML
7
- « Vorherige
- Nächste »
- abacon auf: DateTimeNow and Data Cleansing tools to be conside...
-
TonyaS auf: Alteryx Needs to Test Shared Server Inputs/Timeout...
-
TheOC auf: Date time now input (date/date time output field t...
- EKasminsky auf: Limit Number of Columns for Excel Inputs
- Linas auf: Search feature on join tool
-
MikeA auf: Smarter & Less Intrusive Update Notifications — Re...
- GMG0241 auf: Select Tool - Bulk change type to forced
-
Carlithian auf: Allow a default location when using the File and F...
- jmgross72 auf: Interface Tool to Update Workflow Constants
-
pilsworth-bulie
n-com auf: Select/Unselect all for Manage workflow assets
| Benutzer | Anzahl |
|---|---|
| 7 | |
| 5 | |
| 3 | |
| 2 | |
| 2 |


