Alteryx Designer Desktop Ideas
Share your Designer Desktop product ideas - we're listening!Submitting an Idea?
Be sure to review our Idea Submission Guidelines for more information!
Submission Guidelines- Community
- :
- Community
- :
- Participate
- :
- Ideas
- :
- Designer Desktop: New Ideas
Featured Ideas
Hello,
After used the new "Image Recognition Tool" a few days, I think you could improve it :
> by adding the dimensional constraints in front of each of the pre-trained models,
> by adding a true tool to divide the training data correctly (in order to have an equivalent number of images for each of the labels)
> at least, allow the tool to use black & white images (I wanted to test it on the MNIST, but the tool tells me that it necessarily needs RGB images) ?
Question : do you in the future allow the user to choose between CPU or GPU usage ?
In any case, thank you again for this new tool, it is certainly perfectible, but very simple to use, and I sincerely think that it will allow a greater number of people to understand the many use cases made possible thanks to image recognition.
Thank you again
Kévin VANCAPPEL (France ;-))
Thank you again.
Kévin VANCAPPEL
Alteryx's spatial tools are really powerful and offer a lot of value for analysis. However, when rendering a map for output, there is currently no way to place an image inside of a polygon. This feature would be very useful for customized layers on maps and other spatial-based processes.
My rough suggestion would be to scale a selected image to the size of the polygon's bounding rectangle, and then trim the edges of the image to fit inside the polygon itself.
The SharePoint List Input tool currently doesn't retrieve managed metadata columns from SharePoint lists (confirmed by @DanC in April 2018, Pulling Managed Metadata from a SharePoint List). This severely limits our use of the tool, as imports in Alteryx lack most metadata that is relevant for analysis and reporting.
Would be great if this could be added in a future release.
Thanks,
Lars
To compare a Grid shape before a change and after the change, both shapes should have a reference point where those grids can be created.
The reference point should be changed according to the coordinates system that the designer want to use
I think It would be very beneficial to be able to find the first instance that a field appeared or when its name changed.
So consider the following:
1) Somewhere in my workflow, I use a formula tool and create a new field called Total Assets which is the sum of Asset1 and Asset2.
After my workflow is built (and I failed to do any sort of documentation) it would be nice in the results window if each field name was a highlighted link that took me to the first instance that a field appeared.
In my scenario above if I am downstream and wonder when Total assets appeared (as I might have multiple formula tools, but if could click the field name and it bounced me right to the first instance the field existed -- in this case a formula tool, this would be a huge time saving when troubleshooting.
Thanks,
Seth
1. An ability to right click on a connection and disable it to prevent any processing beyond that connector.
2. An ability to right click and make a tool 'transparent' (on certain tools like filter, with perhaps icon color change to show it is transparent) to see what happens with/without that tool much further down the road in large workflows.
3. An ability to left click on empty space between tools and connectors (the background) and drag the workflow around for faster navigation in large workflows. I know that there is an overview feature for faster navigation, but this should add further ease in navigation process.
4. An ability to make container any shape (lasso-like) and not just rectangular. It would make for much clearer distinction between containers.
5. How about a 'done' button in the new interactive chart so I don't have to 'close'out of it? After making all the adjustments, having to 'close' the display is not very reassuring.
6. How about third dimension (for size) in the scatter tool?
I am not sure if some of the features I requested are already there, if so please point me in the right direction. I did try to search in ideas and community section, but wasn't able to pinpoint to any specific topics I bring up above.
I am using the 2018.3.5.52487 version.
The new insight tool offers some great charting abilities but it does not integrate with other reporting tools. The tool doesn't support pictures,tables or any way to pull text from the data in the workflow in. This really prevents it from being a solution to any of the my reporting needs.
We need color coding in the SQL Editor Window for input tools. We are always having to pull our code out of there and copy it into a Teradata window so it is easier to ready/trouble shoot. This would save us some time and some hassle and would improve the Alteryx user experience. ( I think you've used a couple of my ideas already. This one is a good one too. )


When using the formula tool -- one of the nice features is that when you start typing in a function or variable -- the tool will show formulas/variables that begin with that letter and keep changing as you type in more letters. I believe this is called predictive typing.

However, this does not happen in tools like multi-row or multi-field where a user would have to search for functions and variables if they weren't sure what they are.

Can predictive typing be added to the multi-row and multi-field tools? If I want to take it further, any tool that allows a user to use the formula functionality should be able to see predictive typing.
Thanks,
Seth Moskowitz
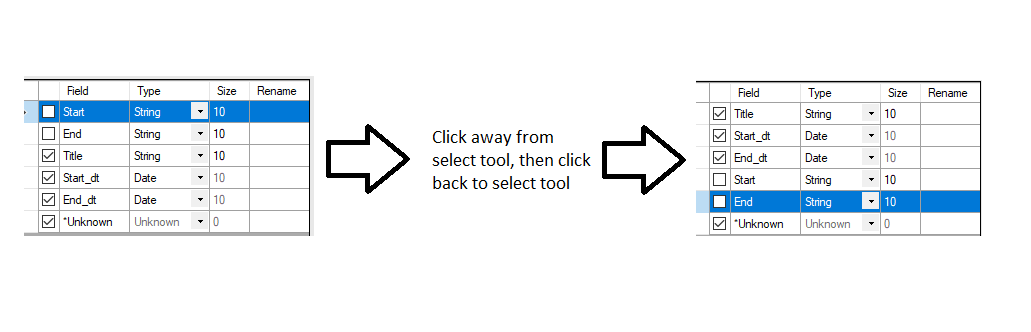
When using the 'Select' tool, often many columns are deselected, making it difficult to locate the remaining selected columns. It would save time to move deselected columns to the bottom of the ‘Select’ tool configuration after leaving the tool. Both selected and de-selected columns should retain their incoming field order within the group.

When the stacked bar chart option is added to the new interactive chart tool it would be fantastic if the functionality can be developed in such a way that waterfall charts can also easily be created. https://community.alteryx.com/t5/Alteryx-Designer-Discussions/Waterfall-Chart-in-Charting-Tool/m-p/1... has a workaround for doing this with the old chart tool but it would be much better if this functionality was a built in option going forward.
I think the Cache and Run Workflow option is a good addition in Alteryx 2018.3 but I think it needs more work to be useful.
For example I build a simple workflow where each tool is fed in by one tool and is used by one tool. So you have a sequence of tools. A -> B --> C --> D -- > E
Say I build A -> B -> C and I put a Cache and Run Workflow option on C, it will run the workflow and cache the output out of C.
But if I build D and E onto it after that event and put the option Cache and Run Workflow on E, it will run the whole workflow ignoring the cache output from C.
Can it be changed where E's Cache and Run Workflow will respect C's Cache and Run Workflow?
Thanks,
Mathew
Please offload map rendering, in Browse Tool, to the video card using DirectX or OpenGL, the software rendering currently used is embarrassingly slow and disruptive.
Hi
We have recently upgraded to 18.3 and noticed that the Filter tool expression box has lost its colour coding of expression elements. The Formula tool (which still has the 18.2 look and feel) however still has the old colour coding.
It would be great if the colour coding could be included for all tools with expression editing boxes.
Examples attached for clarity.
Thanks
Is it possible to have Output like below in Insight?
Ozone | Solar.R | Wind | Temp | Month | Day |
41 | 190 | 7.4 | 67 | 5 | 1 |
36 | 118 | 8 | 72 | 5 | 2 |
12 | 149 | 12.6 | 74 | 5 | 3 |
18 | 313 | 11.5 | 62 | 5 | 4 |
Hi Community:


But when you use that option for your output tool, you can't use the Alteryx flow again; you get an error (Sheet already exists you moron, or Extract already exists stupid) (c'mon, you know Alteryx is judging you and the strikethroughs are there in spirit).

If you ever want to run your workflow again, you've got to change it to 'Overwrite [Sheet (Drop) OR Existing Extract File (Create if does no Exist)]'.
I'm not sure about you, but I've been (passive aggressively?) hoping that with each new release of Alteryx, I would get a means to change my defaults. I would LOVE the option to have my output tools default to the overwrite, rather than create, option automatically. That one step is just... annoying to do over and over again.
So, I'm not going to be a passive-aggressive twit any longer. I am formally asking for what I want like an adult.
Can I please have an option in Options>User Settings>Defaults with a drop-down for Output tool preferences: Create by default, Overwrite by default, Append by default, and whatever the other options are generally categorised according to how the Output tools are done? I really only care about the overwrite one, but you're getting my gist at this point, right?
Thanks so much!
-Cedric
Colourless Green

Never noticed this, because I always use the custom filter option, not the basic. But I had a user come to me asking why his app wasn't updating his filter properly.
He configured the filter tool thusly (dummy data):

And here is the what the action tool looks like when you connect it to the filter tool:

So he simply highlighted the "Bob" line and picked to update "Bob".
However, since he used a basic filter, and not a custom one, this is how he should've configured the action tool:

I realize that "well, it's spelled out for you - there's an expression section & a simple section in the action tool". But for beginners or even non-beginners, it might not be obvious.
It would be nice if when you connect the action too, it only displayed the appropriate option (either custom or simple, but not both).
I recently came to know that Alteryx doesn't support Denodo Data sources. We at our company are using Denodo as a data virtualization tool and also Alteryx is used for data blending. The request is for Alteryx to start supporting Denodo as a data source so that our company can reach out to Alteryx for any support related issues with Denodo.
I'm adding a 'Dynamic Input' tool to a macro that will dynmaically build the connection string based on User inputs. We intend to distribute this macro as a 'Connector' to our main database system.
However, this tool attempts to connect to the database after 'fake' credentials are supplied in the tool, returning error messages that can't be turned off.
In situations like this, I think you'd want the tool to refrain from attempting connections. Can we add a option to turn off the checking of credentials? I assume that others who are building the connection strings at runtime would also appreciate this as well.
As a corollary, for runtime connection strings, having to define a 'fake' connection in the Dynamic Input tool seems redundant, given we have already set the 'Change Entire File Path' option. There are some settings in the data connection window that are nice to be able to set at design time (e.g. caching, uncommitted read, etc.), but the main point of that window to provide the connection string is redundant given that we intend to replace it with the correct string at runtime. Could we make the data connection string optional?
To combine the above points, perhaps if the connection string is left blank, the tool does not attempt to connect to the connection string at runtime.
There are a several ways to store the Avro schema in Hive:
- Literal JSON string stored in the Hive table properties (Alteryx currently supports)
- Reference to the schema file stored elsewhere
- Pass in the schema as a run-time property in Hive
Alteryx only supports Option #1, but that runs into a 4000 Character Limitation which is the default schema limit in Hive’s internal DB. Is it possible to have Alteryx support the other two options to be able to support data sets with large schema definitions?
- New Idea 229
- Accepting Votes 1,823
- Comments Requested 25
- Under Review 160
- Accepted 59
- Ongoing 5
- Coming Soon 9
- Implemented 481
- Not Planned 119
- Revisit 65
- Partner Dependent 4
- Inactive 674
-
Admin Settings
19 -
AMP Engine
27 -
API
11 -
API SDK
217 -
Category Address
13 -
Category Apps
112 -
Category Behavior Analysis
5 -
Category Calgary
21 -
Category Connectors
241 -
Category Data Investigation
76 -
Category Demographic Analysis
2 -
Category Developer
206 -
Category Documentation
78 -
Category In Database
212 -
Category Input Output
634 -
Category Interface
237 -
Category Join
101 -
Category Machine Learning
3 -
Category Macros
153 -
Category Parse
76 -
Category Predictive
77 -
Category Preparation
386 -
Category Prescriptive
1 -
Category Reporting
198 -
Category Spatial
81 -
Category Text Mining
23 -
Category Time Series
22 -
Category Transform
87 -
Configuration
1 -
Data Connectors
952 -
Data Products
1 -
Desktop Experience
1,505 -
Documentation
64 -
Engine
124 -
Enhancement
292 -
Feature Request
212 -
General
307 -
General Suggestion
4 -
Insights Dataset
2 -
Installation
24 -
Licenses and Activation
15 -
Licensing
11 -
Localization
8 -
Location Intelligence
80 -
Machine Learning
13 -
New Request
181 -
New Tool
32 -
Permissions
1 -
Runtime
28 -
Scheduler
23 -
SDK
10 -
Setup & Configuration
58 -
Tool Improvement
210 -
User Experience Design
165 -
User Settings
75 -
UX
220 -
XML
7
- « Previous
- Next »
-
 Qiu
on:
Features to know the version of Alteryx Designer D...
Qiu
on:
Features to know the version of Alteryx Designer D...
- DataNath on: Update Render to allow Excel Sheet Naming
- aatalai on: Applying a PCA model to new data
- charlieepes on: Multi-Fill Tool
- vijayguru on: YXDB SQL Tool to fetch the required data
- apathetichell on: Github support
- Fabrice_P on: Hide/Unhide password button
- simonaubert_bd on: ADBC connectivity : faster columnar storage query
- NeoInfiniTech on: Adjustable Delay for Control Containers
-
Watermark
on:
Dynamic Input: Check box to include a field with D...
| User | Likes Count |
|---|---|
| 53 | |
| 17 | |
| 13 | |
| 10 | |
| 9 |