Alteryx Designer Desktop Ideas
Share your Designer Desktop product ideas - we're listening!Submitting an Idea?
Be sure to review our Idea Submission Guidelines for more information!
Submission Guidelines- Community
- :
- Community
- :
- Participate
- :
- Ideas
- :
- Designer Desktop: New Ideas
Featured Ideas
Hello,
After used the new "Image Recognition Tool" a few days, I think you could improve it :
> by adding the dimensional constraints in front of each of the pre-trained models,
> by adding a true tool to divide the training data correctly (in order to have an equivalent number of images for each of the labels)
> at least, allow the tool to use black & white images (I wanted to test it on the MNIST, but the tool tells me that it necessarily needs RGB images) ?
Question : do you in the future allow the user to choose between CPU or GPU usage ?
In any case, thank you again for this new tool, it is certainly perfectible, but very simple to use, and I sincerely think that it will allow a greater number of people to understand the many use cases made possible thanks to image recognition.
Thank you again
Kévin VANCAPPEL (France ;-))
Thank you again.
Kévin VANCAPPEL
With all the talk of #TeamVertical and #TeamHorizonal an idea emerged for diagonal orientation. Now, it's a funny idea at first glance, but actually having the ability to control the general organization of a workflow could be very helpful. Imagine if there was a dot or arrow like in word that would enable us to tilt the canvas to fit our screens better. Like below, but leaving the text horizontal.

This solves the problem with the Left Join anchors moving to the top and instead allows anyone to rotate their workflow to what fits the case.
Thanks!!
#Team45Degrees
-
Enhancement
-
UX
It would be nice to have 2 tier tool annotations.
Tier 1 would be akin to an H1 title and serve as a condensed descriptive title the user creates.
Tier 2 would be analogous to the current annotation option and provide a mechanism to provide specific details regarding the operation being performed by a specific tool (relative to the workflow).
The default might be to show Tier 1 and hide Tier 2. A user would have the option to show all Tier 2 annotations or chose to show select Tier 2 annotations (much like the current annotation show/hide options). An alternative option might be two depict Tier 2 as a hover over tool tip.
Thoughts?
-
Enhancement
-
UX
It would be great to increase the size of the content displayed in the results window. I use it primarily to exlore data and with my insufficiently good eyesight this is a challenge. Some non-Alteryx solutions were proposed before but I feel they are not sustainable in the long run.
Best
Teba
-
Enhancement
-
UX
When Alteryx Designer detects an existing 32-bit Oracle driver on a user's machine, it displays an error message saying that it requires a 64-bit driver. If there is no driver at all installed, it will go ahead and install one.
Can we get Alteryx to simply prompt the user to install the 64-bit driver instead of the 32-bit driver present error message?
(I know they can co-exist since removing the 32-bit driver will cause Alteryx to install its own 64-bit driver after which one can re-install the 32-bit driver.)
Thanks!
D
-
Desktop Experience
-
Enhancement
-
Installation
Hello Team,
Currently, in the select tool, we have to scroll up or down to check or see the list of the fields. In case, if the user wanted to change the data type, they can scroll into the list. Like, I am working on the mid-size data, and sometimes data contain 300+ fields, if I need to change anything in the data type I have to search by scrolling up or down.
The idea here is, If you provide a search bar under Field, it will be a great help to all, in case if anyone needs to go for some specific field, the user just types the name in the search bar and make changes quickly. The select tool is important and we used much time while working on the flow.
Thank you,
Mayank
-
Enhancement
-
UX
The interactive results pane is great, but wouldn't it be cool if you could interact directly with the result pane to do things like filtering.
There are a few too many steps with the method at the moment, where you need to either copy the value or type it into the filter pop up. A simple right click and filter on selected value would be a big ux improvement.

-
Enhancement
-
UX
On the canvas, underneath the Run button, there are zoom out and zoom in buttons. It would be lovely if between them existed a number box indicating the current zoom level of the canvas. This would operate much like my web browser, which typically shows 100% unless I have zoomed in or out. Bonus points if the button is clickable to reset to the default zoom level.
-
Enhancement
-
New Request
-
UX
Hi Team,
As the formula design that able to stack multiple formula in once. There should have more things there.
1. Error Icon for formula have Error
Can you find which row have error in seconds?

We had to count to find which formula had error!!!!
and how about now?

At least, do have an icon or anything significant thing that let us found it in second and WITHOUT COUNT!!!
2. buttons to expand all/ collapse all.
It was normal that we need to review formula in again in future.
So, you need to click one by by to view all the formulas?
-
Category Preparation
-
Desktop Experience
-
Enhancement
Our company often builds applications where we need the ability for it to dynamically update dropdowns based on a user's previous selections.
For example:
- A user needs to select their Server, database, and table for analysis (3 dropdowns).
- When the user selects their server, a query is run to get a list of all databases on that server. Then the database dropdown will automatically populate with this list of databases.
- The user then makes a database selection, and a query is then run to get all tables within that database. The table dropdown will automatically populate with this list of tables.
- The user makes their table selection, and then runs their analysis using the server, database, and table variables with values that they have selected from each dropdown.
We can do this in other programs, but unfortunately the lack of dynamic selections/dependent dropdowns is a big limitation for us when building Alteryx applications. Our current workarounds are chaining applications together, or using PyQt within the workflow. Chaining is clunky and often causes unforeseen issues when uploading to Server with errors that are non-descriptive, and using PyQt comes with Python versioning issues.
If this interactivity can somehow be added to Alteryx applications it would be a huge upgrade to our current Alteryx processes. Any suggestions for further workarounds would also be helpful!
Thank you,
Amanda
-
Category Apps
-
Desktop Experience
-
Enhancement
Hi team,
Currently, we can FILTER results in the result window using some string operations like "String equals", "String Contains", etc.
Firstly, it's a great feature. Kudos for the same.
However, it would be really helpful if we can add the IN operator functionality to this Result window FILTER.
Most of the time, we always want to check for multiple values while filtering the data.
I am attaching a screenshot of the FILTER location that I am referring to!

For eg, In the above screenshot of the result window, I want to filter for Name IN ('Bullock County','Baldwin County','Butler County')
Kindly look into this.
Thanks in advance.
Regards,
Shreyansh Rathod
-
Enhancement
-
UX
Please consider making the Count Record tool configurable so that users can receive a visual read of results in canvas. This would quickly assist in ensuring a user's ability to verify a workflow is functioning as expected or not. Currently there is no in canvas visual cue tied to the counter. If a user is expecting a certain count result (e.g. zero), the user has to click on the count records function to see if the result meets expectations or not. Users may spend a lot of time checking each stage of a workflow to ensure everything is flowing appropriately. A visual cue of results would reduce that time to check. Outside of runtime errors, there is currently no visual cue to indicate a possible problem or unexpected exception to a filter or other macro.
Two suggestions:
1) Allow users to color code count results in specific count results or ranges. (e.g. if a user is expecting a zero count, allow them to change the color of the counter to red for anything not resulting in zero and green if count is zero). Or allow them to set a color range depending on the count total (e.g. a user may need some visual tolerance indicator with a count under 100 as green, 101-200 as yellow, 201-300 as orange and 300+ as red).
2) Show the actual count in the Count Record macro icon.
Thank you!
-
API SDK
-
Category Developer
-
Enhancement
Would like to be able to connect to the Stibo STEP system/database as a Data Source. Some people have the Stibo server on-premise while others have it hosted in Amazon (AWS).
Not sure what else I could provide at this point for further details.
-
Engine
-
Enhancement
Hello Alteryx Gurus -
I've got some workflows that run daily, but there are times, depending on the breaks, wherein I don't get any data from one of my data sources. Which is actually fine, nobody did Job X today. But it makes Alteryx puke out and I get an error message emailed to me. Ultimately, I've got to hop into the rather voluminous log entries to determine if this was a data stream not initialized / was empty error, or something else that I actually need to care about.
That being said, in the coding realm, it is relatively simple to look for specific flavors of exceptions and then just eat them without notifying people. So, why not add something to the runtime / events panel for emailing at error time to allow for ignoring data stream not initialized errors? In this way, I could get notified when there is a real error I need to pay attention to, and not get notified when there is no new data, which isn't really that big a deal.
Thank you for attending my TED talk on enhanced error reporting and exception classification capabilities.
-
Engine
-
Enhancement
Hi
The wording of the tool tip displayed in results window cells with long strings is misleading. The current wording is "This cell has truncated characters".

New users tend to infer that this means that the data value has been truncated somewhere upstream. See here, here and here. Changing this message to something like "Only a portion of long strings is displayed" will help reduce the confusion immensely.
Dan
-
Enhancement
-
UX
When building API calls within Alteryx there are a few common steps required
1) Build out the URI for the API call (base URL plus any query parameters)
2) Deal with authentication, such as basic authentication requires taking a key and secret, base 64 encoding and passing this into the tool
3) parsing the results out and processing these downstream
For this idea I am specifically focusing on step 3 (but it would be great to have common authentication methods in-built within the download tool (step 2)!).
There are common steps required to parse out the results, such as using Filter (to check for a 200 response), JSON parse, text to columns and then cross tab to get the results into a readable format. These will all be common steps anyone who has worked with APIs will be familiar with:

This is all fine for a regular user to quickly add in and configure these tools. However there is no validation here for the JSON result being as expected, which when embedding an API into a batch macro or analytic app means it can easily fail.
One example of a failure which I've recently come across is where the output JSON doesn't have all fields (name:value pairs) depending the json response. For example using the UK Companies House API, when looking at the ceased to act field at this endpoint - https://developer-specs.company-information.service.gov.uk/companies-house-public-data-api/resources... the ceased to act field only appears in the results if a person has actually ceased to act. This is important if you have downstream tools such as a formula to create a field [Active] where you have:
IF ISNull([ceased_to_act]) THEN "Active" ELSE "Ceased to Act" ENDIFHowever without modification the macro / app will error if any results are returned where there is not this field.
A workaround is to add in the Crew Ensure Fields or union on a list of fields, to ensure that the Cease to Act field is present in the output for all API calls. But looking at some other tools it would be good if an expected Schema could be built in to the download tool to do this automatically.
For example in Power Automate this is achieved as follows:

I am a big advocate of not making things unnecessarily complicated. Therefore I would categorise this as an ease of use feature to improve the experience of working with APIs within Alteryx and make APIs (as load of integrations are API based) accessible to as many users as possible.
-
API SDK
-
Category Developer
-
Enhancement
-
UX
Hello
I have searched the community but haven't found any obvious solutions to this.
When using a cross tab I often find that there shouldn't be any aggregated values and if there is it means there is an issue with my data or workflow.
Therefore I think a useful feature would be an option for the cross tab tool to be able to return an error if it trying to aggregate any values.
I have a work around by using a summarize tool to count the non unique records and then a test to see if there are any duplicates but I think this could be a useful addition to the tool.
Thanks
-
Category Transform
-
Desktop Experience
-
Enhancement
Hi all,
When debugging an error, we need to verify tool by tool in a sequence to better understand what is really going on.
Sometimes the tools are miles away from each other. Imagine a gigantic workflow with a lot of connections going back and forth and wireless connections everywhere to help the workflow organization. Here is an example with more than 1300 tools:

My idea is to have a shortcut showing all the previous/next tools and by selecting the previous/next one you go directly to them.
Something like this:

What do you guys think about that?
Best,
Fernando Vizcaino
-
Enhancement
-
UX
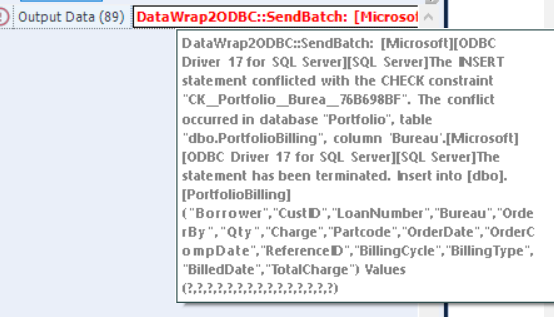
Issue:
Oftentimes when a workflow has an error, the error message is very long and is difficult to read in the results window. Currently, if you hover over the error message in the results window, the error message will popout but only for a couple seconds. Reading the error messages is a crucial step in troubleshooting the issue with a workflow, however, with the current experience it becomes very difficult to read the entire error message prior to the popout expiring.
Solution:
Simply double clicking any message, especially an error message, in the results window should have a permanent popout window presented to the user. This message window will allow the user to scroll down to read the entire message (if lengthy), popout the window further, minimize the window, and exit the window entirely.
-
Enhancement
-
UX
Hi,
This idea is to suggest we add additional comparison capability to the Designer Join tool to more closely mirror what is possible in SQL. Usually, teams work around this limitation by adding tools after the Join tool (or using SQL queries at the start of a workflow), but it would be great to do this in the Join Tool itself.
The current Join Tool in Alteryx only allows for exact field comparisons, but not for more flexible joins, such as the example below
LOAD * FROM Table A
LEFT Join Table B
ON A.Firstname=B.FirstName
And A.Country <> B.Country
AND A.Lastname LIKE (B.Lastname)
OR A.Nationality = B.Nationality
I've drawn a mock-up of what I think could be enhancements to the existing tool. In simple terms, I think there are these options for improvement:
1. When joining on specific fields, allow the user to specify operators for how the fields should join, e.g. Field A=Field B and Field C !Contains Field D (almost like the Filter Tool does this). This could be enabled by permitting operators in the menu between the 2 fields, as illustrated below
2. Have the option to say that if either field matches, you'd like to join (i.e. option to choose if this is an AND or OR join condition). A new field would need to be made to the left of the field selection, as illustrated below
3. Perhaps there could be the option to write the expression as you would a formula for the Error message tool (but in a positive context), e.g. Field A != Field B
4. How about enabling the Left Join/Right Join/Full Outer Join options from within the Join tool? E.g. if you select the Venn Diagram buttons, you will return your selection? If you don't want to compromise existing capability, you can automatically add a pre-configured Union tool (with the correct left/right/join inputs) after the Join tool based on the user's selection?

Regards,
Tom
-
Category Join
-
Desktop Experience
-
Enhancement
When using the Sharepoint Output tool - we have seen a few situations (which are widely reported in the designer discussions thread) where the write to sharepoint fails, but no error is raised.
This often happens because of mismatch in data types, but we've also seen this for other reasons (e.g. we had this once due to column ordering). In the worst case - this can end up with the sharepoint list being emptied out if the write fails on the first item, again with no error indicator.
The Sharepoint Input and Output are very widely used as a way of giving users a very simple UI to input data that can flow into an Alteryx Canvas - so this is a very commonly used pattern in our environment.
Could we request that the Sharepoint output tool be changed to include explicit errors and warnings on write, so that the user has a guarantee that either the write took place or there was an error to reflect the issue?
Thank you.
-
Engine
-
Enhancement
- New Idea 241
- Accepting Votes 1,819
- Comments Requested 25
- Under Review 165
- Accepted 58
- Ongoing 5
- Coming Soon 9
- Implemented 481
- Not Planned 119
- Revisit 65
- Partner Dependent 4
- Inactive 674
-
Admin Settings
19 -
AMP Engine
27 -
API
11 -
API SDK
218 -
Category Address
13 -
Category Apps
112 -
Category Behavior Analysis
5 -
Category Calgary
21 -
Category Connectors
242 -
Category Data Investigation
76 -
Category Demographic Analysis
2 -
Category Developer
208 -
Category Documentation
80 -
Category In Database
212 -
Category Input Output
635 -
Category Interface
237 -
Category Join
101 -
Category Machine Learning
3 -
Category Macros
153 -
Category Parse
76 -
Category Predictive
77 -
Category Preparation
388 -
Category Prescriptive
1 -
Category Reporting
198 -
Category Spatial
81 -
Category Text Mining
23 -
Category Time Series
22 -
Category Transform
87 -
Configuration
1 -
Data Connectors
954 -
Data Products
1 -
Desktop Experience
1,514 -
Documentation
64 -
Engine
125 -
Enhancement
304 -
Feature Request
212 -
General
307 -
General Suggestion
4 -
Insights Dataset
2 -
Installation
24 -
Licenses and Activation
15 -
Licensing
11 -
Localization
8 -
Location Intelligence
80 -
Machine Learning
13 -
New Request
181 -
New Tool
32 -
Permissions
1 -
Runtime
28 -
Scheduler
23 -
SDK
10 -
Setup & Configuration
58 -
Tool Improvement
210 -
User Experience Design
165 -
User Settings
77 -
UX
222 -
XML
7
- « Previous
- Next »
- nzp1 on: Easy button to convert Containers to Control Conta...
-
 Qiu
on:
Features to know the version of Alteryx Designer D...
Qiu
on:
Features to know the version of Alteryx Designer D...
- DataNath on: Update Render to allow Excel Sheet Naming
- aatalai on: Applying a PCA model to new data
- charlieepes on: Multi-Fill Tool
- seven on: Turn Off / Ignore Warnings from Parse Tools
- vijayguru on: YXDB SQL Tool to fetch the required data
- bighead on: <> as operator for inequality
- apathetichell on: Github support
- Fabrice_P on: Hide/Unhide password button
| User | Likes Count |
|---|---|
| 164 | |
| 20 | |
| 13 | |
| 11 | |
| 7 |