Alteryx Designer Desktop Ideas
Share your Designer Desktop product ideas - we're listening!Submitting an Idea?
Be sure to review our Idea Submission Guidelines for more information!
Submission Guidelines- Community
- :
- Community
- :
- Participate
- :
- Ideas
- :
- Designer Desktop: New Ideas
Featured Ideas
Hello,
After used the new "Image Recognition Tool" a few days, I think you could improve it :
> by adding the dimensional constraints in front of each of the pre-trained models,
> by adding a true tool to divide the training data correctly (in order to have an equivalent number of images for each of the labels)
> at least, allow the tool to use black & white images (I wanted to test it on the MNIST, but the tool tells me that it necessarily needs RGB images) ?
Question : do you in the future allow the user to choose between CPU or GPU usage ?
In any case, thank you again for this new tool, it is certainly perfectible, but very simple to use, and I sincerely think that it will allow a greater number of people to understand the many use cases made possible thanks to image recognition.
Thank you again
Kévin VANCAPPEL (France ;-))
Thank you again.
Kévin VANCAPPEL
It would be great to be able to output a report to Adobe Illustrator (.ai). This would allow us to refine the presentation, or hand it off to a graphics department to do that for us. It would especially be great for the map reporting tool, as many GIS people finish maps in AI to give a more polished result. This would allow Alteryx to compete better with Esri as far as map creation.
I can only really speak to map creation, but please comment if you have another use case.
-
Category Reporting
-
Desktop Experience
I use the Render tool daily to generate Excel reports with multiple worksheets.The page layout/format is global. Many of my report include 30+ columns of data in multiple tabs, along with a summary tab, with fewer columns.
When formatting the page size, if I don't set "Custom" and some very large number (30-50), Alteryx randomly truncates the headings and any text in the data. If set the page size to such a large number, the "summary" Excel tab (which may only contain 5 columns) is set to the same page format as the larger worksheets. I actually have end-users complain that they have to resize the summary page. A "page format by worksheet" would allow a landscape orientation, with a page size of 8 1/2 X 11 for the "summary" worksheet, and "custom" for the others.
The version of Excel in the "Temp Excel Output" is still 2007. Can we get this updated?
-
Category Reporting
-
Desktop Experience
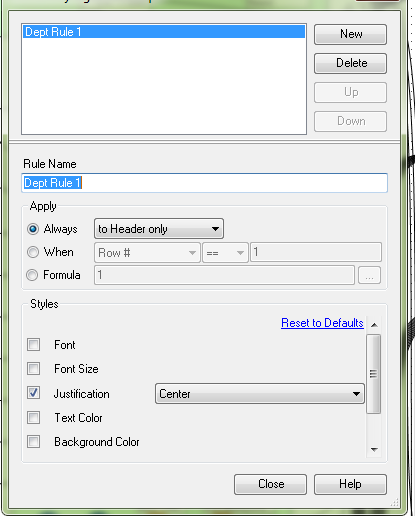
I keep making the same changes to the table tool rules, using the same formulas when I build new reports. For example, Row Rule 1: Font, bold; Background Color, green; Row Rule 2; Font, bold; Background Color, blue; Row Rule 3; Font, bold; Background Color, yellow. Each is based on a formula: IsEmpty([Column Name]). I do this over and over and over again. The only thing that changes is the column name. It would be nice to have the Row Style Rules saved so they can be browsed to" or inserted.
Still waiting for the Default Table Settings to include "CENTER" in the header tab.
-
Category Reporting
-
Desktop Experience
While exporting a report to Excel via the Table/Layout/Render tools, it would be helpful to have the ability to manually adjust the size of specific columns within the report table.
Currently, Alteryx auto-corrects the column widths based on the data in the columns and the selected paper size, even if you select specific column widths using the Table tool. This is a great feature for reporting, however in my use-case my output report contains two blank columns which will be manually edited by my team. Because these two "manual update" columns are blank in Alteryx, the column widths on the output are quite small compared to the other columns, and this will require manual column width formatting within the Excel sheet to both accommodate the (often lengthy) manual updates that will be entered into these two columns, and to keep the report within the paper size parameters.
Thanks!
Taryn
-
Category Reporting
-
Desktop Experience
I am frequently using comments within my containers to tell an engaging story to my business Audience about the workflow I have built. However, whenever I start adding, removing, moving tools etc within containers these comments don't remain static within the relative position of the container and drift into positions that I have to manually adjust.
From a time saving perspective it would be great if I could:
1. fix the position of comment within a container and
2. Group comments in a way similar to how you can group objects in Visio and Photoshop

-
Category Documentation
-
Category Input Output
-
Category Reporting
-
Data Connectors
As my Alteryx workflows are becoming more complex and involve integrating and conforming more and more data sources it is becoming increasingly important to be able to communicate what the output fields mean and how they were created (ie transformation rules) as output for end user consumption; particular the file target state output.
It would be great if Alteryx could do the following:
1. Produce a simple data dictionary from the Select tool and the Output tool. The Select tool more or less contains everything that is important to the business user; It would be awesome to know of way to export this along with the actual data produced by the output tool (hopefully this is something I've overlooked and is already offered).
Examples:
- using Excel would be to produce the output data set in one sheet and the data dictionary for all of its attributes in the second sheet.
- For an odbc output you could load the data set to the database and have the option to either create a data dictionary as a database table or csv file (you'd also want to offer the ability to append that data to the existing dictionary file or table.
2. This one is more complex; but would be awesome. If the workflow used could be exported into a spreadsheet Source to Target (S2T) format along with supporting metadata / data dictionary for every step of the ETL process. This is necessary when I need to communicate my ETL processes to someone that cannot afford to purchase an alteryx licence but are required to review and approved the ETL process that I have built. I'd be happy to provide examples of how someone would likely want to see that formatted.
-
Category Data Investigation
-
Category Documentation
-
Category In Database
-
Category Reporting
It would be awesome if I could re-display the users selections to them before I continue with the remainder of the workflow in an analytic app. That way, I could collect all of the UI inputs, do my validation on the values provided and then re-display the selections/options/text to the user so they can confirm that they are correct and they wish to continue, or they can stop the processing and make changes via the already-open UI without having to re-enter everything from scratch.
Then, when someone selects something that's potentially harmful or very time consuming, I can confirm their selections and alert them to potential issues.
Using Render tool to create an excel document.
(This is for a specific use case)
If you are using the RENDER tool to create one or more EXCEL documents. Ensure that you are NOT explicitly stating the Sheet name in the file name. (Output file or 'Replacing entire Path with Group).
If you explicitly name the sheet, it will throw an inboundPipe error.
Remove the sheet name, and it should work fine.
-
Category Reporting
-
Desktop Experience
14 is a bit large to have as the default text size in the Report Text Tool. Can we make it a "normal" size like 11 or 12? I am always forgetting to change it when setting up automated emails, and have to go back and edit it.
Can either be a setting, or we should just change the default to a normal size.
Text in this post set to 14(4 looked close) for effect.
Thanks!
-
Category Reporting
-
Desktop Experience
It would be good if the Email Tool could be enhanced so that it can send HTML e-mails, by that I mean the body of the e-mail is HTML based on a field in the workflow that contains a string of HTML.
Currently we are having to use batch files with command line e-mail clients to send e-mail with HTML generated within Alteryx workflows.
-
Category Reporting
-
Desktop Experience
When I put a map snippet into a report, there is no border. Therefore, road segments just terminate into whitespace.
Please add an option to create a border around the map snippet.

-
Category Reporting
-
Desktop Experience
Can you look at improving the table tool? something to look at:
- background/alternate color off or none so we don't have any fill color in Excel
- Table header alignment option vertical AND horizontal - different from row alignment.
- make it dynamic for rules - so if _currentfieldname contains 'percent' then back ground color =yellow, if contains 'Rank' then green etc. Split between header & data. I know it could be accomplished with a macro and xml but that's a tedious process and having it in the tool just makes sense.
Thanks!
simon
-
Category Reporting
-
Desktop Experience
As Tableau has continued to open more APIs with their product releases, it would be great if these could be exposed via Alteryx tools.
One specifically I think would make a great tool would be the Tableau Document API (link) which allows for things like:
- Getting connection information from data sources and workbooks (Server Name, Username, Database Name, Authentication Type, Connection Type)
- Updating connection information in workbooks and data sources (Server Name, Username, Database Name)
- Getting Field information from data sources and workbooks (Get all fields in a data source, Get all fields in use by certain sheets in a workbook)
For those of us that use Alteryx to automate much of our Tableau work, having an easy tool to read and write this info (instead of writing python script) would be beneficial.
-
Category Connectors
-
Category Reporting
-
Data Connectors
-
Desktop Experience
Note from one of our customers:
All our pharmacy images are mainly tiff format only. Since we don’t have the options TIFF to PNG or JPG converter in the BLOB converter tool in Alteryx.
We are not able convert and display the image from alteryx to PDF or Report display tool in Alteryx.
As our images are critical components of our Reporting options . This impact us to use this tool for the below use cases and we are not able move forward on this activity with Alteryx Tool.
-
Category Reporting
-
Desktop Experience
Hi,
As per our project, we need to publish the image into a PDF file which will be downloaded from web URL. when we download the image from web URL that will be saved as TIF format in our local machine. This TIF format is not being supported by Alteryx.
The tool needs an enhancement (to support TIFF) which can be used for converting tiff format to other format OR directly tiff image should be usable in the report.
Thanks,
Raju Miyapuram
-
Category Reporting
-
Desktop Experience
Changing the User Setting "Default Distance Units" doesn't only change the distance units for the Spatial tool. Bizarrely, it also changes page margin specs in the Render tool, and Height and Width specs in tools like Layout.
Separating "Distance" units from "Layout" units would be useful. I may want a map showing kilometers, but when I'm laying it out on an 8.5 x 11 page, I want a half inch margin...
-
Category Reporting
-
Desktop Experience
I would like to see either the option to create a Venn Diaram within the current chart tool or an entirely new tool specifically for Venn Diagrams.
I often work with data from multiple sources and would like to better understand how much of my data is in multiple sources and how much is only from a single source. A great way to view this is with a Venn Diagram.
-
Category Reporting
-
Desktop Experience
Description: I have configured a number of customized MapServer files rather than having to manually configure each layer in the ReportMap tool.
For reference, these are stored in the <Alteryx Data Install Folder>\AlteryxMap\TomTom_US_2015_Q3, for the TomTom US - Current Vintage reference base map. Below is a picture of the many versions of the .map configuration file I have created.

Rationale: Using these different files is cumbersome and inefficient. To switch out a map file, I have to rename the current .map file to a dummy name. Then I have to rename the desired file to be the name that the existing file was. Additionally, I can only have one .map file in use at any one time and all of the workflows running use the same one.
Idea: Allow user to choose which .map file to use from within the Report Map tool.
-
Category Reporting
-
Desktop Experience
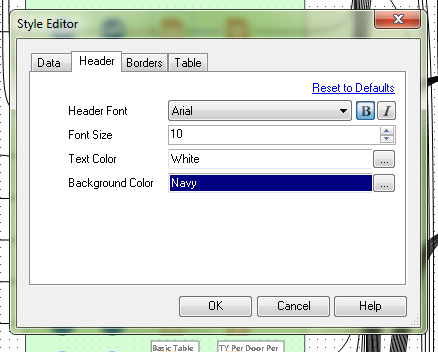
Currently, in order to change the header and data justification to CENTER, one has to select the "Column Rules" button for each column configuration. In a large report (25+ columns), that means selecting each time. It would be more efficient to have the header justification in the Default Table Settings style editor. There is already a setting for font, font size, bold or itallic, text color and background color. I have never created a report for someone where they did not want the headers centered. The workaround is to only feed one column through, then to change the column rules for that column and the Cynamic or Unknown Fields. This works fine, but when I have a report that creates an Excel workbook with 5+ tabs, it gets annoying. It's even more time consuming when I have a report tab, that I need to create sub headings for, so there are multiple report tools for one Excel tab.
-
Category Preparation
-
Category Reporting
-
Desktop Experience
I am currently using alteryx to generate pdf reports and noticed there is no option to have multiple row headers. In my line of work i cant skip this as the end users insist on having it like they have always had it.
I definitely think this should be available as many of us like replicate canned reports which are otherwise in excel and hence see the need for such an option.
The following might give an example of the multi row header,

Also the ability to merge certain columns to create the above effect should be available.
-
Category Documentation
-
Category Reporting
-
Desktop Experience
- New Idea 229
- Accepting Votes 1,823
- Comments Requested 25
- Under Review 160
- Accepted 59
- Ongoing 5
- Coming Soon 9
- Implemented 481
- Not Planned 119
- Revisit 65
- Partner Dependent 4
- Inactive 674
-
Admin Settings
19 -
AMP Engine
27 -
API
11 -
API SDK
217 -
Category Address
13 -
Category Apps
112 -
Category Behavior Analysis
5 -
Category Calgary
21 -
Category Connectors
241 -
Category Data Investigation
76 -
Category Demographic Analysis
2 -
Category Developer
206 -
Category Documentation
78 -
Category In Database
212 -
Category Input Output
634 -
Category Interface
237 -
Category Join
101 -
Category Machine Learning
3 -
Category Macros
153 -
Category Parse
76 -
Category Predictive
77 -
Category Preparation
386 -
Category Prescriptive
1 -
Category Reporting
198 -
Category Spatial
81 -
Category Text Mining
23 -
Category Time Series
22 -
Category Transform
87 -
Configuration
1 -
Data Connectors
952 -
Data Products
1 -
Desktop Experience
1,505 -
Documentation
64 -
Engine
124 -
Enhancement
292 -
Feature Request
212 -
General
307 -
General Suggestion
4 -
Insights Dataset
2 -
Installation
24 -
Licenses and Activation
15 -
Licensing
11 -
Localization
8 -
Location Intelligence
80 -
Machine Learning
13 -
New Request
181 -
New Tool
32 -
Permissions
1 -
Runtime
28 -
Scheduler
23 -
SDK
10 -
Setup & Configuration
58 -
Tool Improvement
210 -
User Experience Design
165 -
User Settings
75 -
UX
220 -
XML
7
- « Previous
- Next »
-
 Qiu
on:
Features to know the version of Alteryx Designer D...
Qiu
on:
Features to know the version of Alteryx Designer D...
- DataNath on: Update Render to allow Excel Sheet Naming
- aatalai on: Applying a PCA model to new data
- charlieepes on: Multi-Fill Tool
- vijayguru on: YXDB SQL Tool to fetch the required data
- bighead on: <> as operator for inequality
- apathetichell on: Github support
- Fabrice_P on: Hide/Unhide password button
- simonaubert_bd on: ADBC connectivity : faster columnar storage query
- NeoInfiniTech on: Adjustable Delay for Control Containers
| User | Likes Count |
|---|---|
| 54 | |
| 17 | |
| 13 | |
| 10 | |
| 9 |