Alteryx Designer Desktop Ideas
Share your Designer Desktop product ideas - we're listening!Submitting an Idea?
Be sure to review our Idea Submission Guidelines for more information!
Submission Guidelines- Community
- :
- Community
- :
- Participate
- :
- Ideas
- :
- Designer Desktop
Featured Ideas
Hello,
After used the new "Image Recognition Tool" a few days, I think you could improve it :
> by adding the dimensional constraints in front of each of the pre-trained models,
> by adding a true tool to divide the training data correctly (in order to have an equivalent number of images for each of the labels)
> at least, allow the tool to use black & white images (I wanted to test it on the MNIST, but the tool tells me that it necessarily needs RGB images) ?
Question : do you in the future allow the user to choose between CPU or GPU usage ?
In any case, thank you again for this new tool, it is certainly perfectible, but very simple to use, and I sincerely think that it will allow a greater number of people to understand the many use cases made possible thanks to image recognition.
Thank you again
Kévin VANCAPPEL (France ;-))
Thank you again.
Kévin VANCAPPEL
Idea:
Some well known scoring methods use optimal binned variables for added robustness. Let's add this capability to Alteryx.
Retionale:
Here's a basic link on why to do that; http://documents.software.dell.com/statistics/textbook/optimal-binning
Current status in Alterys as I'm aware of:
Tile tool or Multi-field Binning tool for completing same task as Tile tool on multiple fields, splits the variables by 5 methods;
Equal Records or Intervals or Sums
Smart Tile
Unique Value
Manual
Unfortunately "equal something" binnings are bad idea, as the values are categorized "blindly" irrespective of the effects on the predictive power of the models.
What to do:
What's needed is to bin both numerical and categorical variables optimally such that the Weights of Evidences (WoE) should present a monotone increasing or decreasing pattern. Maybe at most a V or U shaped "convex" structure.
Quick win:
Without constraining ourselves with monotonicity or convex cases, the easiest practice would be running a C4.5 or CHAID tree algorithm (produces multiple splits rather than binary splits in CART) for a single variable and select the target as the dependent variable and all the resulting nodes will be the bins we are looking for. Doing this for multiple variables at once is the key to the tool to be generated.
Clients:
This capability is sought by risk management departments building robust, stable Basel compliant models in financial industry, especially by banks.
-
Category Predictive
-
Category Preparation
-
Category Transform
-
Desktop Experience
I am not sure if this capability exists but I assume it does not.
We have a need to optimize a Linear Program (LP) model that consists of a system of equations and has both:
An objective function and a series of constraints. One of the software capabilities that SAS offers that currently
Alteryx does not have is this optimization capability.
I am wondering if the capability is currently not available, is this capability in the Product Roadmap?
Thanks,
Ricardo
-
Category Predictive
-
Desktop Experience
I had an issue with the ARIMA tool using the R function auto.arima() which missed the obvious seasonality in my data set, but when I manually adjusted Model Customization > Customize the parameters used for automatic model creation > The seasonal components > Alter the degree of seasonal differencing and selected 1, the outputs were much better. The problem is that while this fixes my singular ARIMA model, I want to be able to run this through Model Factory too as I have hundreds of data sets on which I'd have to make this adjustment since auto.arima() misses the seasonality on most of them and produces useless results. Apparently I'm not alone in having this issue as I was directed to another comment thread where someone had the same problem and desired fix as me.
TL/DR version -- please make is possible to manually adjust the parameters of the ARIMA Model Factory tool, or at the very least add the option to alter the degree of seasonal differencing.
And for supporting information, here is my thread:
https://community.alteryx.com/t5/Advanced-Analytics/ARIMA-model-missing-seasonality/m-p/87776#M3000
And here is the other thread where a different person had the same issue:
https://community.alteryx.com/t5/Advanced-Analytics/TS-Forecasting/td-p/28857
-
Category Predictive
-
Category Time Series
-
Desktop Experience
Hi Alteryx Team,
Would love to see alteryx incorporate Risk Modeling techniques under its umbrella. Mainly cover topics like Basel Norms, LGD, Default at Risk etc.
-
Category Predictive
-
Desktop Experience
TLDR: Add a parameter repeat (rep) to the Neural Network configuration panel, and probably other Predictive tools. This would make the tool return only the best trained model out of #rep.
I have done some research by comparing the R neuralnet function (from Neuralnet package) and the Alteryx Neural Network tool. I thought that the XOR example was a good one to evaluate a neural network system since it is one of the most basic non-linear tables.
- R Neuralnet function
The neuralnet function is able to train and predict the 4 configurations of a XOR table (see page 3 of https://cran.r-project.org/web/packages/neuralnet/neuralnet.pdf for the test script).
However several attempts must be made. This is why the parameter
rep=5
is important, followed with
plot(net.xor, rep="best")
This way, instead of 1, 5 sets of initial parameters are randomly generated and 5 neural networks are trained independently. When plotting, only the neural network with the lowest error is plotted (I got 3% error). For XOR, around 5 tries seem to be enough to find a set of parameter that guesses the 4 situations of the table correctly.
Another parameter of the function is stepmax:
"The maximum steps for the training of the neural network. Reaching this maximum leads to a stop of the neural network’s training process."
This rules the max number of iteration for each single attempt viewed previously.
If one writes stepmax = 100 instead of rep = 5, the only resulting Neural Network usually does not have an average error below 5% (actually I get 49,7%).
- Alteryx Neural Network
The Neural Network tool in Alteryx has a parameter documented as follow
"The maximum number of iterations for model estimation: This value controls the number of attempts the algorithm can make in attempting to find improvements in the set of model weights relative to the previous set of weights. If no improvements are found in the weights prior to the maximum number of iterations, the algorithm will terminate and return the best set of weights. This option defaults to 100 iterations. In general, given the behavior of the algorithm, it is likely to make sense to increase this value if needed, at the cost of lengthening the runtime for model creation."
I tried this workflow with this parameter set to default value 100, and even greater values, and I cannot get an average error below 5% (I get stuck around 50%).
After reading carefully these pieces of documentation and testing, I can guess that this last parameter is the equivalent of stepmax.
If this is right, then it would be practical to add an equivalent for the parameter rep to the configuration panel. This parameter seems more useful than rep to me. Maybe there is already a way to simulate this parameter; if that is so, please let me know, otherwise I am going to include an R script to my workflow.
-
Category Predictive
-
Desktop Experience
Hello,
as shown in the Alteryx Inspire Demo, Assisted modeling is going to work with a wizard and generate several tools as result.
The data evaluation functions and feature engineering assist however would be extremely useful tools in their own, is there any chance we can use them as separate tools in the upcoming version?
Thanks in advance!
-
Category Predictive
-
Desktop Experience
-
Feature Request
-
Machine Learning
Add a new feature to develop your own customized decision tree with Insight. So instead of using a tree generated with the Decision Tree tool a user can generate a tree with custom splits and save the splitting rules as a model to score later a new dataset. This will provide user the ability to enhace a tree with business knowledge.
-
Category Predictive
-
Category Reporting
-
Desktop Experience
When I checked out if there is a way to force the intercept to 0 or some other constant value, it's not doable from the tool configurations.

So manually we can have "0" intercept in linear regression this way (edit the macro's R tool)
cars.lm <- lm(dist ~ speed, data = cars)
cars.lm2 <- lm(dist ~ 0 + speed, data = cars)
summary(cars.lm)
# Adding the 0 term tells the lm() to fit the line through the origin
So a minor addition of a tickbox will solve that and make that linear regression tool more flexible i guess...
Best...
-
Category Predictive
-
Desktop Experience
It is nice that there is a sample node option for In-DB, however it isn't a random sample. It isn't always feasible for me to stream out and use the random sample % option. In fact on numerous occasions when I use the Data Stream Out option in DB I often times have workflows crash because it can't handle the number of records I am trying to stream out.
-
Category In Database
-
Category Predictive
-
Category Preparation
-
Data Connectors
I suggest adding a piece wise linear regression tool to the predictive tool set. Many times, modelers in the insurance business (and others) like to play around with the model, i.e. placing knots/splines at multiple intervals then after seeing the results, changing where those knots are placed. This gives the best fit based not only on mathematical technical knowledge but also domain/tribal knowledge, especially when training data sets are small.
Currently, we have to try and develop our own model matched with a macro which changes the r-code. To date, there has been no luck, but maybe the Alteryx excellent customer support would get the developers to do this for us and then...........we could finally bury SAS in the ground.
-
Category Predictive
-
Desktop Experience
We recently upgraded our SQL server to 2016 to enable us to use R Server for predictive analytics. We were excited about the more powerful algorithms and the fact that parallel processing will make things faster on bigger data sets.
We often use stepwise logistic regression, especially in cases where we need to show which attributes are most significant. The one drawback about the upgrade was that stepwise is not available when running logistic regression in-database. I know there are ways to get around this e.g. PC etc. but it would be nice to have the ability to do stepwise in-database.
I hope there are others like me that will vote this up. I think it will help a lot of data scientists out there and is probably one of the easier suggestions :-).
-
Category In Database
-
Category Predictive
-
Data Connectors
-
Desktop Experience
Hello! Almost all statistical softwares allow for the analyst to use either a pairwise or a listwise option when applying clustering techinques. This option affects only how the inner distance matrix is built, and after that whichever algorithm you choose is peformed. However in Alteryx [K-Centroids] by default does listwise, classifying only those records where the selected variables have no nulls.
Please consider adding this option!
PS: the difference is pairwise will build the distance between 2 variables depending on those records that have no nulls on both variables, while listwise will run the distance matrix after it has checked for complete non null records in all variables of interest (not one at a time distance calculation).
-
Category Data Investigation
-
Category Predictive
-
Desktop Experience
I am trying to run batch regressions on a pretty sizable set of data. About ~1M distinct groups of data, each wtih 30-500 x,y pairs.
A batch macro with a linear regression works ok - but it is really slow. Started at about 2-3s per regression. After stripping out bunch or reporting from the macro, I am down to ~2s. This is still feels quite slow compared to something purpose built.
Has anyone experimented with higher speed versions that just dump out m,b, & r2?
-
Category Predictive
-
Desktop Experience
There is a web hosted trial that anyone can have a hands on experiance with alteryx tutorials without even downoading the tool.
That's awesome... http://goo.gl/dpSoe2
It may be a nice idea to;
1) either start seperate "Alteryx-kaggle" instances with data sets specific to each kaggle competition so that anyone want to try out may have a go with those well known examples thru the Alteryx site,
2) Or even better have a partnership with kaggle so that anyone can just have it's own Alteryx trial per specific competition on the kaggle website...
I'm sure this will draw a lot of attention...
Rationale;
You'll immediately have a greater reach in Kaggle community, some data hobbiyists and cs, ie students and acedemics (which will eventually end up doing lot's of data blending when ther are going to be hired by top notch firms...
-
Category Interface
-
Category Predictive
-
Desktop Experience
Idea:
In forecasting and in commercial/sme risk scoring there is a need for trying vast number of algebraic equations which is a very cumbersome prosess. Let's add symbolic regression as a new competitive capability.
Rationale:
Summations, ratios, power transforms and all combinations of a like are needed to be tested as new variables for a forecasting or prediction model. Doing this by hand manually is a though and long business... And there is always a possibility for one to skip a valuable combination.
Symbolic regression is a novel techinique for automatically generating algebraic equations with use of genetic programming,
In every evolution a variable is selected checked if the equation is discriminatitive of the target variable at hand. In every next step frequently observed variables will be selected more likely.

Benefit for clients:
This method produces variables mainly with nonlinear relationships. It is a technique that will help in corporate/commercial/sme risk modelling, such that powerful risk models are generated from a hort list of B/S and P/L based algebraic equations.
There is potential use cases in algorithmic trading as well...
There are 3 very interesting world problems solved with symbolic regression here.
A very relevant thesis by sean Wouter is attached as a pdf document for your reading pleasure...
R side of things:
I've found Rgp package for genetic programming, here is a link.
Competition:
I haven't seen something similar in SAS, SPSS but there is this; http://www.nutonian.com/products/eureqa/
Also there is Bruce Ratner's page
-
Category Predictive
-
Category Preparation
-
Desktop Experience
-
Category Predictive
-
Desktop Experience
I have been using the outputs from Spline Regression to facillitate analysis of demographic data (specifically Department of Labor Quarterly Employment data). I have data from 1992Q1 to 2014Q1 and use Spline Regression to get fitted values for each quarter with predictors being the year/quarter, Year/quarter multiplied by a dummy variable for each of the 4 US Presidents, and a dummy variable for each president.
So I can compare results across various groupings by geographic, and other levels as well as the BLS aggregation level. I can analyze raw data or have the values to be fitted indexed to 1992Q1.
I use the default settings for Spline and it builds the best fit including where the node periods for each spline section. To help interpret the results, though, I use the output to compare the actual vs. fitted values (e.g. employment Level) and then look at the changes by quarter.
With the spline regression building the best model with optimal line segments, the results make it possible to see how employment progress or regress correletat with with presidential terms of office or specific impacts of economic recessions on employment data.
I can supply an example of the process, if anyone is interested.
I'd appreciate any comments and/or suggestions to improve the process or interpret the results.
-
Category Predictive
-
Desktop Experience
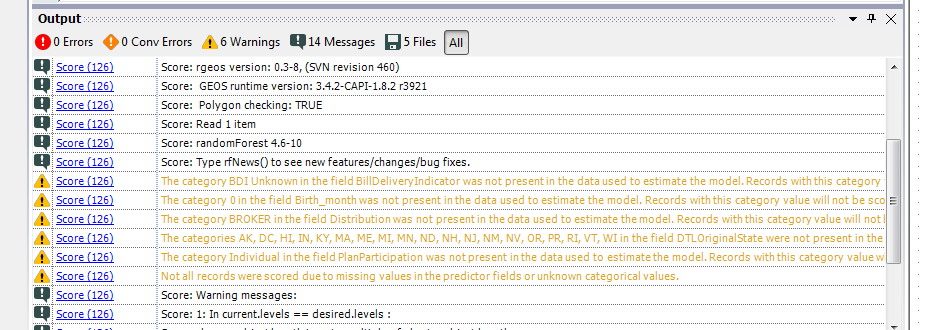
Hi,
My boss and I uses a MB Rules Tool.
He is in trouble because the settings are not what he wants.
It seems that many combinations will come out.
↓
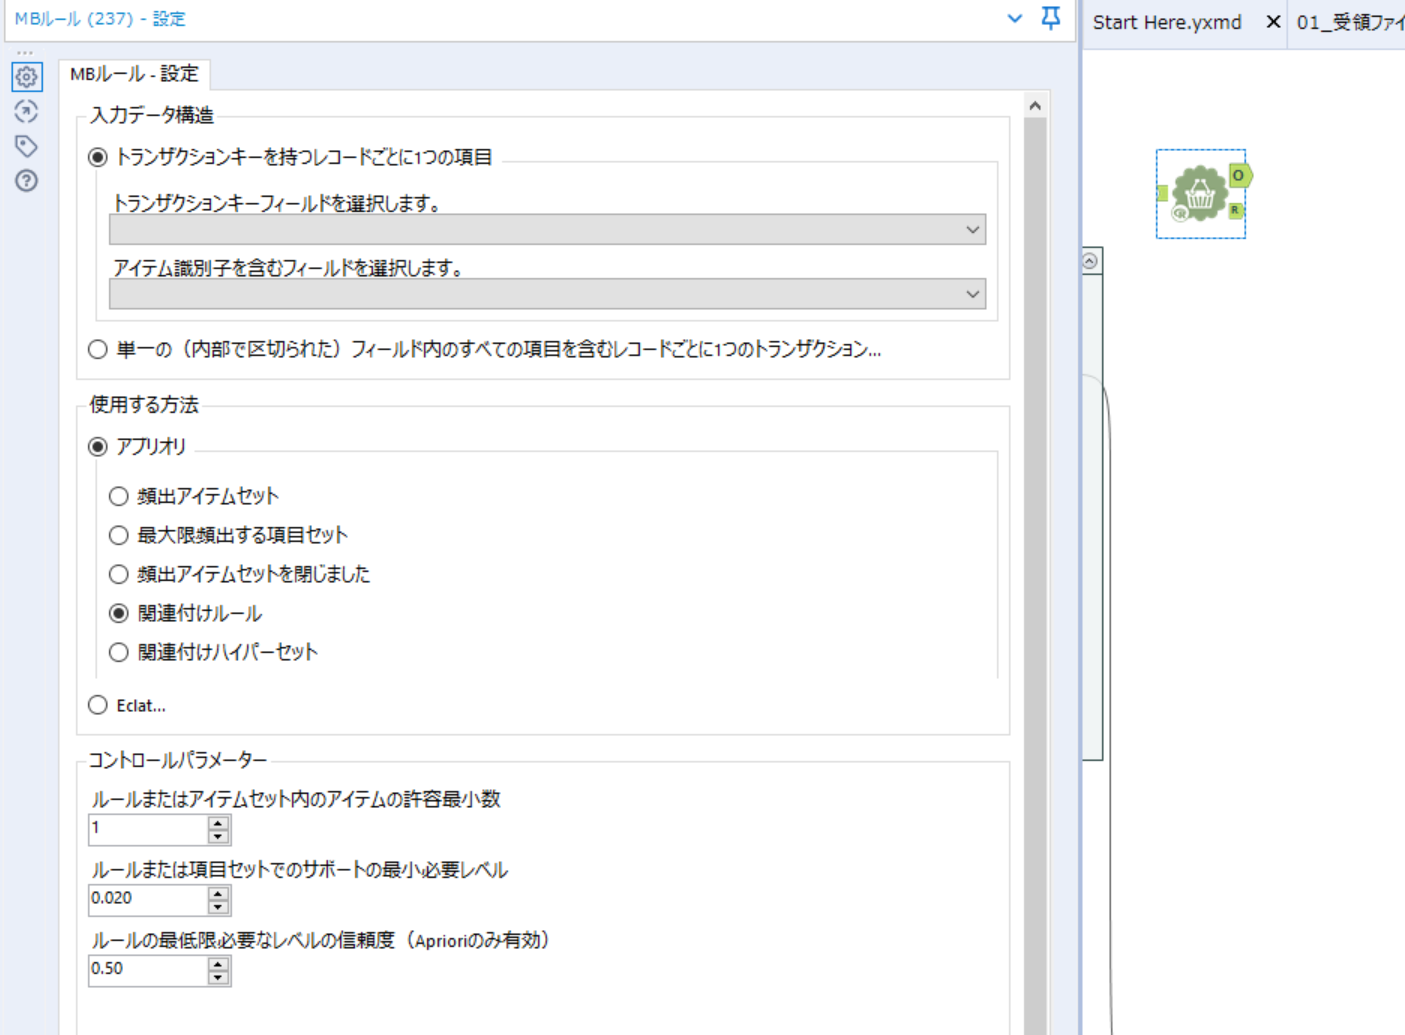
Control Parameters
The allowable minimum number of items in a rule or itemset.
I would like you to inprove or add this parameter to "Maximize".
Modeler seems to be able to set the maximum.
.png)
-
Category Predictive
-
Desktop Experience
Hi,
Can we please make the TS Model Factory customisable to both ARIMA and ETS? I understand that currently it is using auto.arima for R, it would be nice to add the option to customise p,q,P and Q.
Thank you.
-
Category Macros
-
Category Predictive
-
Category Time Series
-
Desktop Experience
I was able to add the following lines of R script to get the importance of the variables used in the cluster analysis. This will allow the user to see what variables are important in determining the clusters they have.
The script I added is below. It is pretty basic and could used spruced up by an Alteryx engineer as far as column naming, accounting for contingencies, and making it a reporting function. I think this would be a valuable feature for future versions of this tool.
library(FeatureImpCluster)#load library
FeatureImp_res <- FeatureImpCluster(clus.sol,as.data.table(the.matrix)) #Use FeatureImpCluster to take the cluster model (clus.sol) and data (the.matrix) to get variable imp.
FeatureImp_df <- as.data.frame(FeatureImp_res$featureImp) #turns features from a list to dataframe
FeatureImp_df_rn <- tibble::rownames_to_column(FeatureImp_df, "Variable") #Adds the variable name to the importance scores
write.Alteryx(FeatureImp_df_rn, 3) #outputs dataframe in output #3
-
Category Predictive
-
Desktop Experience
- New Idea 229
- Accepting Votes 1,823
- Comments Requested 25
- Under Review 160
- Accepted 59
- Ongoing 5
- Coming Soon 9
- Implemented 481
- Not Planned 119
- Revisit 65
- Partner Dependent 4
- Inactive 674
-
Admin Settings
19 -
AMP Engine
27 -
API
11 -
API SDK
217 -
Category Address
13 -
Category Apps
112 -
Category Behavior Analysis
5 -
Category Calgary
21 -
Category Connectors
241 -
Category Data Investigation
76 -
Category Demographic Analysis
2 -
Category Developer
206 -
Category Documentation
78 -
Category In Database
212 -
Category Input Output
634 -
Category Interface
237 -
Category Join
101 -
Category Machine Learning
3 -
Category Macros
153 -
Category Parse
76 -
Category Predictive
77 -
Category Preparation
386 -
Category Prescriptive
1 -
Category Reporting
198 -
Category Spatial
81 -
Category Text Mining
23 -
Category Time Series
22 -
Category Transform
87 -
Configuration
1 -
Data Connectors
952 -
Data Products
1 -
Desktop Experience
1,505 -
Documentation
64 -
Engine
124 -
Enhancement
292 -
Feature Request
212 -
General
307 -
General Suggestion
4 -
Insights Dataset
2 -
Installation
24 -
Licenses and Activation
15 -
Licensing
11 -
Localization
8 -
Location Intelligence
80 -
Machine Learning
13 -
New Request
181 -
New Tool
32 -
Permissions
1 -
Runtime
28 -
Scheduler
23 -
SDK
10 -
Setup & Configuration
58 -
Tool Improvement
210 -
User Experience Design
165 -
User Settings
75 -
UX
220 -
XML
7
- « Previous
- Next »
-
 Qiu
on:
Features to know the version of Alteryx Designer D...
Qiu
on:
Features to know the version of Alteryx Designer D...
- DataNath on: Update Render to allow Excel Sheet Naming
- aatalai on: Applying a PCA model to new data
- charlieepes on: Multi-Fill Tool
- vijayguru on: YXDB SQL Tool to fetch the required data
- apathetichell on: Github support
- Fabrice_P on: Hide/Unhide password button
- simonaubert_bd on: ADBC connectivity : faster columnar storage query
- NeoInfiniTech on: Adjustable Delay for Control Containers
-
Watermark
on:
Dynamic Input: Check box to include a field with D...
| User | Likes Count |
|---|---|
| 53 | |
| 17 | |
| 13 | |
| 10 | |
| 9 |