Alteryx Designer Desktop Ideas
Share your Designer Desktop product ideas - we're listening!Submitting an Idea?
Be sure to review our Idea Submission Guidelines for more information!
Submission Guidelines- Community
- :
- Community
- :
- Participate
- :
- Ideas
- :
- Designer Desktop : Nouvelles idées
Featured Ideas
Hello,
After used the new "Image Recognition Tool" a few days, I think you could improve it :
> by adding the dimensional constraints in front of each of the pre-trained models,
> by adding a true tool to divide the training data correctly (in order to have an equivalent number of images for each of the labels)
> at least, allow the tool to use black & white images (I wanted to test it on the MNIST, but the tool tells me that it necessarily needs RGB images) ?
Question : do you in the future allow the user to choose between CPU or GPU usage ?
In any case, thank you again for this new tool, it is certainly perfectible, but very simple to use, and I sincerely think that it will allow a greater number of people to understand the many use cases made possible thanks to image recognition.
Thank you again
Kévin VANCAPPEL (France ;-))
Thank you again.
Kévin VANCAPPEL
Good afternoon,
I work with a large group of individuals, close to 30,000, and a lot of our files are ran as .dif/.kat files used to import to certain applications and softwares that pertain to our work. We were wondering if this has been brought up before and what the possibility might be.
Good afternoon,
I work with a large group of individuals, close to 30,000, and a lot of our files are ran as .dif/.kat files used to import to certain applications and softwares that pertain to our work. We were wondering if this has been brought up before and what the possibility might be.
it would be nice Street Geocoding tool can be capable of accepting Latitude and Longitude and spit out the address like Reverse Geo Coding . The reverse Geo coding currently using TomTom is too slow to process hundred thousands records.. if the data is already local to our system in form of CASS or Street Geocoder that will be certainly faster.
Yeah, so when you have 15 workflows for some folks and you've actually decided to publish to a test database first, and now you have to publish to a production database it is a *total hassle*, especially if you are using custom field mappings. Basically you have to go remap N times where N == your number of new outputs.
Maybe there is a safety / sanity check reason for this, but man, it would be so nice to be able to copy an output, change the alias to a new destination, and just have things sing along. BRB - gotta go change 15 workflow destination mappings.
When saving my workflows to the gallery I'd like to see the description field be populated with the text I used during the last save. I like to add text here and it is frustrating to have to re-type it every time.
It's been a while since I was last on these forums, and I can't find the suggestions subforum, only one massive 'Designer' forum. Hopefully I'm posting this in the correct place.
Anyway, the font colour on my Basic filter dialog dropdowns is for some reason bizarrely light and difficult to read. How do I fix this? It used to be a black font, so I'm trying to figure out what I've done wrong. It needs to be darker. Thanks

There should be an option to not update values with Null-values in the database, when using the tool Output Data, with the options:
- File Format = ODBC Database (odbc:)
- Output Options = Update;Insert if new
This apply to MS SQL Server Databases for my part, but might affect other destinations as well?
Alteryx's spatial tools are really powerful and offer a lot of value for analysis. However, when rendering a map for output, there is currently no way to place an image inside of a polygon. This feature would be very useful for customized layers on maps and other spatial-based processes.
My rough suggestion would be to scale a selected image to the size of the polygon's bounding rectangle, and then trim the edges of the image to fit inside the polygon itself.
To compare a Grid shape before a change and after the change, both shapes should have a reference point where those grids can be created.
The reference point should be changed according to the coordinates system that the designer want to use
I think It would be very beneficial to be able to find the first instance that a field appeared or when its name changed.
So consider the following:
1) Somewhere in my workflow, I use a formula tool and create a new field called Total Assets which is the sum of Asset1 and Asset2.
After my workflow is built (and I failed to do any sort of documentation) it would be nice in the results window if each field name was a highlighted link that took me to the first instance that a field appeared.
In my scenario above if I am downstream and wonder when Total assets appeared (as I might have multiple formula tools, but if could click the field name and it bounced me right to the first instance the field existed -- in this case a formula tool, this would be a huge time saving when troubleshooting.
Thanks,
Seth
1. An ability to right click on a connection and disable it to prevent any processing beyond that connector.
2. An ability to right click and make a tool 'transparent' (on certain tools like filter, with perhaps icon color change to show it is transparent) to see what happens with/without that tool much further down the road in large workflows.
3. An ability to left click on empty space between tools and connectors (the background) and drag the workflow around for faster navigation in large workflows. I know that there is an overview feature for faster navigation, but this should add further ease in navigation process.
4. An ability to make container any shape (lasso-like) and not just rectangular. It would make for much clearer distinction between containers.
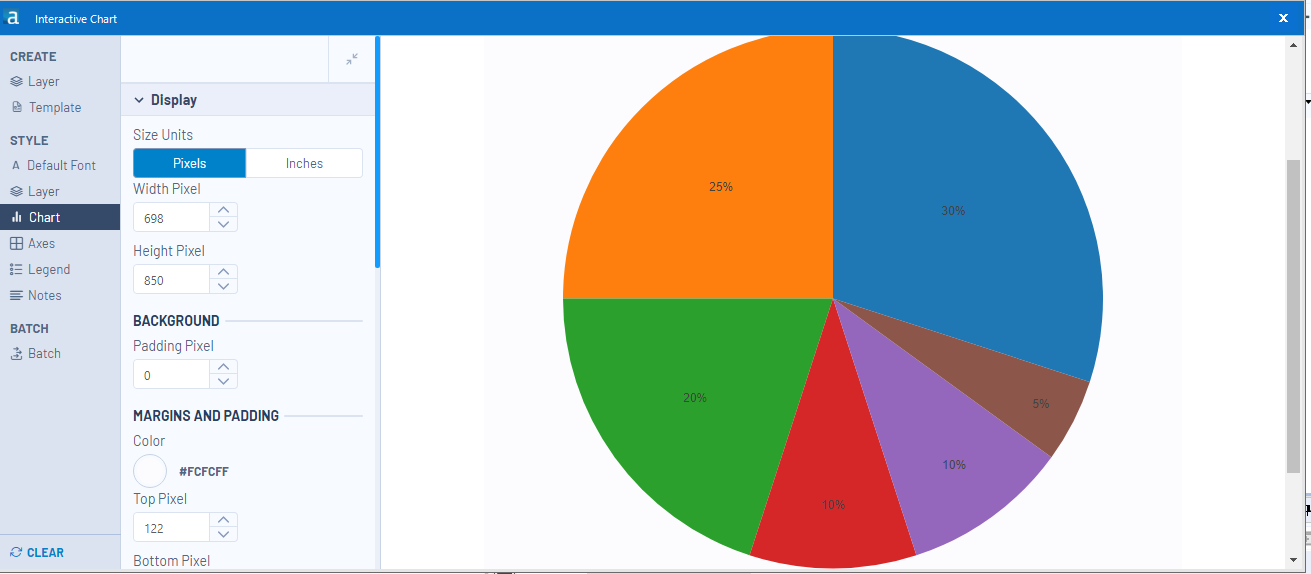
5. How about a 'done' button in the new interactive chart so I don't have to 'close'out of it? After making all the adjustments, having to 'close' the display is not very reassuring.
6. How about third dimension (for size) in the scatter tool?
I am not sure if some of the features I requested are already there, if so please point me in the right direction. I did try to search in ideas and community section, but wasn't able to pinpoint to any specific topics I bring up above.
I am using the 2018.3.5.52487 version.
The new insight tool offers some great charting abilities but it does not integrate with other reporting tools. The tool doesn't support pictures,tables or any way to pull text from the data in the workflow in. This really prevents it from being a solution to any of the my reporting needs.
Please offload map rendering, in Browse Tool, to the video card using DirectX or OpenGL, the software rendering currently used is embarrassingly slow and disruptive.
Is it possible to have Output like below in Insight?
Ozone | Solar.R | Wind | Temp | Month | Day |
41 | 190 | 7.4 | 67 | 5 | 1 |
36 | 118 | 8 | 72 | 5 | 2 |
12 | 149 | 12.6 | 74 | 5 | 3 |
18 | 313 | 11.5 | 62 | 5 | 4 |
There are a several ways to store the Avro schema in Hive:
- Literal JSON string stored in the Hive table properties (Alteryx currently supports)
- Reference to the schema file stored elsewhere
- Pass in the schema as a run-time property in Hive
Alteryx only supports Option #1, but that runs into a 4000 Character Limitation which is the default schema limit in Hive’s internal DB. Is it possible to have Alteryx support the other two options to be able to support data sets with large schema definitions?
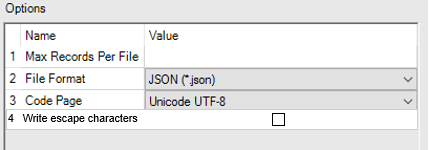
When outputting files, it is usually beneficial for characters that would cause trouble with formatting/syntax to be properly escaped. However, there are situations where suppressing this behavior is desirable.
Of particular importance for such a feature is in the outputting of JSON files. Currently, if a file is output as JSON it will always have quotations escaped if they occur within a field, regardless of whether this conforms to the JSON standard. There are a variety of current workaround for this, including pre-formatting all fields to look like JSON and then outputting as a \0 delimiter CSV, but in many cases there is no need to escape any characters when outputting a JSON.
A simple toggle--as was created for suppressing BOM in CSVs--to disable character escaping would make the creation of JSON objects simpler and reduce the amount of workarounds required to output proper JSON.
I think the Nearest Neighbor Algorithm is one of the least used, and most powerful algorithms I know of. It allows me to connect data points with other data points that are similar. When something is unpredictable, or I simply don't have enough data, this allows me to compare one data point with its nearest neighbors.
So, last night I was at school, taking a graduate level Econ course. We were discussing various distance algorithms for a nearest neighbor algorithm. Our prof discussed one called the Mahalanobis distance. It uses some fancy matrix algebra. Essentially it allows it it to filter out the noise, and only match on distance algorithms that are truly significant. It takes into account the correlation that may exists within variables, and reduces those variables down to only one.
I use Nearest Neighbor when other things aren't working for me. When my data sets are weak, sparse, or otherwise not predictable. Sometimes I don't know that particular variables are correlated. This is a powerful algorithm that could be added into the Nearest Neighbor, to allow for matches that might not otherwise be found. And allow matches on only the variables that really matter.
Can you please enable option to select multiple performance measures in AB Trend tool.
Currently we can only choose one metrics
Curl currently doesn't have Secure protocols supported. Please find below screen-shot. We are currently using Alteryx 11.7.6

Can Alteryx take this as feature request and add the secure libraries to existing cURL tool so that it can support the secure SFTP protocol.
- New Idea 274
- Accepting Votes 1 815
- Comments Requested 23
- Under Review 173
- Accepted 58
- Ongoing 6
- Coming Soon 19
- Implemented 483
- Not Planned 115
- Revisit 61
- Partner Dependent 4
- Inactive 672
-
Admin Settings
20 -
AMP Engine
27 -
API
11 -
API SDK
218 -
Category Address
13 -
Category Apps
113 -
Category Behavior Analysis
5 -
Category Calgary
21 -
Category Connectors
247 -
Category Data Investigation
77 -
Category Demographic Analysis
2 -
Category Developer
208 -
Category Documentation
80 -
Category In Database
214 -
Category Input Output
640 -
Category Interface
239 -
Category Join
103 -
Category Machine Learning
3 -
Category Macros
153 -
Category Parse
76 -
Category Predictive
77 -
Category Preparation
394 -
Category Prescriptive
1 -
Category Reporting
198 -
Category Spatial
81 -
Category Text Mining
23 -
Category Time Series
22 -
Category Transform
89 -
Configuration
1 -
Content
1 -
Data Connectors
963 -
Data Products
2 -
Desktop Experience
1 537 -
Documentation
64 -
Engine
126 -
Enhancement
330 -
Feature Request
213 -
General
307 -
General Suggestion
6 -
Insights Dataset
2 -
Installation
24 -
Licenses and Activation
15 -
Licensing
12 -
Localization
8 -
Location Intelligence
80 -
Machine Learning
13 -
My Alteryx
1 -
New Request
194 -
New Tool
32 -
Permissions
1 -
Runtime
28 -
Scheduler
23 -
SDK
10 -
Setup & Configuration
58 -
Tool Improvement
210 -
User Experience Design
165 -
User Settings
80 -
UX
223 -
XML
7
- « Précédent
- Suivant »
-
 NicoleJ
sur :
Disable mouse wheel interactions for unexpanded dr...
NicoleJ
sur :
Disable mouse wheel interactions for unexpanded dr...
- TUSHAR050392 sur : Read an Open Excel file through Input/Dynamic Inpu...
- NeoInfiniTech sur : Extended Concatenate Functionality for Cross Tab T...
- AudreyMcPfe sur : Overhaul Management of Server Connections
-
AlteryxIdeasTea
m sur : Expression Editors: Quality of life update - StarTrader sur : Allow for the ability to turn off annotations on a...
- simonaubert_bd sur : Download tool : load a request from postman/bruno ...
- rpeswar98 sur : Alternative approach to Chained Apps : Ability to ...
-
 caltang
sur :
Identify Indent Level
caltang
sur :
Identify Indent Level
- simonaubert_bd sur : OpenAI connector : ability to choose a non-default...
| Utilisateur | Compte |
|---|---|
| 23 | |
| 5 | |
| 5 | |
| 5 | |
| 5 |