Alteryx Designer Desktop Ideas
Share your Designer Desktop product ideas - we're listening!Submitting an Idea?
Be sure to review our Idea Submission Guidelines for more information!
Submission Guidelines- Community
- :
- Community
- :
- Participate
- :
- Ideas
- :
- Designer Desktop
Featured Ideas
Hello,
After used the new "Image Recognition Tool" a few days, I think you could improve it :
> by adding the dimensional constraints in front of each of the pre-trained models,
> by adding a true tool to divide the training data correctly (in order to have an equivalent number of images for each of the labels)
> at least, allow the tool to use black & white images (I wanted to test it on the MNIST, but the tool tells me that it necessarily needs RGB images) ?
Question : do you in the future allow the user to choose between CPU or GPU usage ?
In any case, thank you again for this new tool, it is certainly perfectible, but very simple to use, and I sincerely think that it will allow a greater number of people to understand the many use cases made possible thanks to image recognition.
Thank you again
Kévin VANCAPPEL (France ;-))
Thank you again.
Kévin VANCAPPEL
I am currently working on building self-serve Analytics apps for colleagues and I am using the Email tool for this. However, the credentials have to entered directly into the tool and whenever the password changes this needs to be again changed into the workflow by the workflow developer.
This means that:
A) Workflow developer needs to have access to the mailbox used in the From field
B) Only the developer's email address can be used in the From field
C) The developer needs to connect with mailbox user in person or over video-conference, share control of his own machine and have the user put in their credentials every time the mailbox user's password changes.
These are three major hindrances in using the email tool to its full potential.
Solution:
Provide an option in the Alteryx server to have a database where users can create a record of their credentials (hashed of course) and with each record a token number is generated. The token number can be shared with the developer who will update that in the email tool. Whenever the password changes, the user can directly retrieve his old credentials and change them using the same token number. This method will eliminate the above mentioned three constraints and allow for use of email tool to create complete self-serve apps.
-
Category Reporting
-
Desktop Experience
I am trying to generate the multiple sheets in the same Excel using Render tool. one of the sheet having around 100 columns and other two sheets are having only 20 columns. If am configuring paper size to 50 inches in render tool, its affecting the other sheets too and Report doesn't look good since columns width are getting extended to some extent.
So, it will more helpful if there is an option to configure each sheet paper size or a rule kind of thing.
Please let me know if there are any option to that.
Thanks in advance...
-
Category Reporting
-
Desktop Experience
Hello!
I have a very regional problem, when we use reporting tools, they seem to be encoded in ansi, but in France, we use a lot of accents, and when we want to use the mail tool, we have to "write wrong" with e instead of é for instance, would it be possible to make it possible for us to use accents, I saw a solution in this post (https://community.alteryx.com/t5/Alteryx-Designer-Discussions/French-Characters-in-an-Email-using-Re...) but if it would be possible to have the option directly in the reporting tools it would be a lot easier for us to use them in an automated way!
-
Category Reporting
-
Desktop Experience
It would be great to have the ability to use a word file as a template and create a pdf as the output which can be emailed to a list of emails through alteryx.
-
Category Reporting
-
Desktop Experience
Please enable "Friendly Name" in the e-mail tool.
e.g. None <none@none.com>
When using this configuration, the workflow fails with error:
Error: Email (1): ComposerEmailInterface: Record#1 From Field contains 2 entries
"Fiendly Name" does work when sending a Workflow Event e-mail, but not in the e-mail tool.

-
Category Reporting
-
Desktop Experience
-
Tool Improvement
I use the Render tool daily to generate Excel reports with multiple worksheets.The page layout/format is global. Many of my report include 30+ columns of data in multiple tabs, along with a summary tab, with fewer columns.
When formatting the page size, if I don't set "Custom" and some very large number (30-50), Alteryx randomly truncates the headings and any text in the data. If set the page size to such a large number, the "summary" Excel tab (which may only contain 5 columns) is set to the same page format as the larger worksheets. I actually have end-users complain that they have to resize the summary page. A "page format by worksheet" would allow a landscape orientation, with a page size of 8 1/2 X 11 for the "summary" worksheet, and "custom" for the others.
The version of Excel in the "Temp Excel Output" is still 2007. Can we get this updated?
-
Category Reporting
-
Desktop Experience
In Render tool you can use a field to group by and use that field to alter the output file name somewhat similar to the output tool. Unfortunately it is not exactly like the output tool. Usually you have a table tool and or layout or visual layout tool before the Render. In my most recent scenario I have several outputs I use the Table tool for to format, the text tool to generate headings and the visual layout tool to organize these headings and tables into coherent sections on a final output used as a dashboard.
Fine and dandy except a new requirement now divides these data based on client so I tried to find a way to pass the Client code through to the Render tool so it could dynamically alter the output file so each client gets their version without manually creating multiple replicated streams to format. But the Render tool requires a field and if I am passing a table it can't reference columns (fields) within the table and if I build a client code field to pass outside the table I can't seem to find a way to tag it to the table and text going into the layout or in some way pass it into the layout tool in a meaningful way to reach the Render tool for use in dynamic rename of output file.
I wish there was a way to pass a field into the Render tool to modify output file name whether feeding it tables or other data or mixed elements. Maybe a pass through element or something?
-
Category Reporting
-
Desktop Experience
When I'm working with a new data or tool set, I'd find it helpful to know which tools other analysts are using.
I'm envisioning an optional, dockable window where a list of tools (and possibly percentage/probability rank) exist to suggest the next tool most users add after the selected tool (or blank canvas).
For example, I open a new workflow and the window shows the following suggestions of tools:

Next, I add a File Input. While the File Input tool is selected, the list updates to show the most utilized tool after a File Input:

If I click back onto the blank canvas though, the suggestion window reverts to:
Ideally, there would be the option of the Community stats and/or your local server/enterprise stats.
-
Category Reporting
-
Desktop Experience
I would like to be able to email attachments to fileshare sites. I can't because the email that Alteryx sends out is missing the required header data that tells the fileshare there is an attachment.
This is what the email should have but it does not.
X-MS-Has-Attach: yes
I worked this issue with Alteryx support probably a year ago and had hoped to see this as an improvement, but it's not there.
There are other ways to get data to fileshare sites, and every single one of them has failed for various reasons. Email would by far be the simplest way if the right header data were included.
-
Category Reporting
-
Desktop Experience
It would be lovely if the Image tool supports GIFs when using the .PCXML and HTML options in the render tool. Understandably, it would use it's .PNG format when using other render options, such as PDF etc.
-
Category Reporting
-
Desktop Experience
Hey @A11yKyle and Alteryx Accessibility Team! It would be great if we could add alt text (dynamic based on input data would be even better!) and set the tab order of rendered PDFs so we could create reporting outputs that are digitally accessible.
-
Category Reporting
-
Desktop Experience
Service Now dashboards really don't give me as much flexibility as I need, but can't help thinking an Alteryx connector coupled with Qlik Sense dashboards would be fantastic. SNOW seem to be supportive of Tableau - have you guys got plans to get in on the action?
-
Category Connectors
-
Category Reporting
-
Data Connectors
-
Desktop Experience
It would be good to be able to constrain the size of an image in the vertical direction as well as the horizontal. I am currently working on a report that has an image in the middle of a page of text. If the user inputs an image that is not the same size as my test image, it can push text onto the next page which ruins the report. Having the image next to the text and constraining horizontally is not an option with this project.
-
Category Reporting
-
Desktop Experience
porWYSIWYG - What you see is what you get...
WYSIWYG implies a user interface that allows the user to view something very similar to the end result while the document is being created.[3] In general, WYSIWYG implies the ability to directly manipulate the layout of a document without having to type or remember names of layout commands.[4]
Looking forward to have such a Reporting layout designer, embed all pictures, tables, graphs, legend, header, footer...
Just like in Qliksense and tableau...


-
Category Reporting
-
Desktop Experience
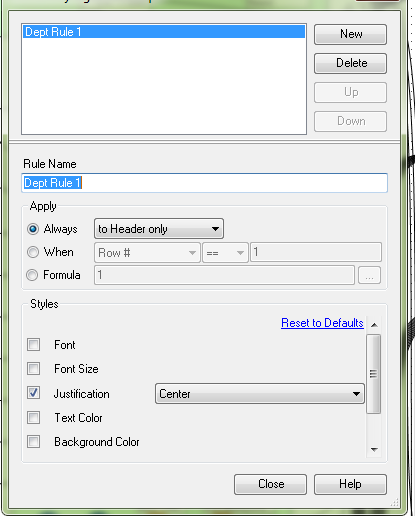
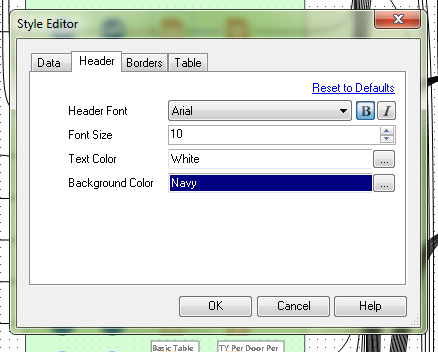
Currently, in order to change the header and data justification to CENTER, one has to select the "Column Rules" button for each column configuration. In a large report (25+ columns), that means selecting each time. It would be more efficient to have the header justification in the Default Table Settings style editor. There is already a setting for font, font size, bold or itallic, text color and background color. I have never created a report for someone where they did not want the headers centered. The workaround is to only feed one column through, then to change the column rules for that column and the Cynamic or Unknown Fields. This works fine, but when I have a report that creates an Excel workbook with 5+ tabs, it gets annoying. It's even more time consuming when I have a report tab, that I need to create sub headings for, so there are multiple report tools for one Excel tab.
-
Category Preparation
-
Category Reporting
-
Desktop Experience
Chris
-
Category Reporting
-
Desktop Experience
Hi
The native email tool is great up to a certain volume, but at high volume it makes more sense to use sendgrid to take advantage of its features like deliverability etc
Would be great if there was a ready-made connector tool for SendGrid
Thanks
-
Category Reporting
-
Desktop Experience
We would like to see more configuration options for renders to PowerPoint PPT. Specifically, we would like to be able to add headers, footers, and repeat column headers in the same way we can with PDF renders.
Refer to this unresolved question:
Powerpoint as an output of macro
-
Category Reporting
-
Desktop Experience
-
Category Reporting
-
Desktop Experience
I see the ability to increment the Vertical Axis on a chart, but not the dates on the Horizontal Axis (data is in date format). This is unreadable for the data I am trying to present, even after changing font. Would like to show 1 date per week, instead of every day (for example).
Thanks!
Gary
-
Category Reporting
-
Desktop Experience
- New Idea 376
- Accepting Votes 1,784
- Comments Requested 21
- Under Review 178
- Accepted 47
- Ongoing 7
- Coming Soon 13
- Implemented 550
- Not Planned 107
- Revisit 56
- Partner Dependent 3
- Inactive 674
-
Admin Settings
22 -
AMP Engine
27 -
API
11 -
API SDK
228 -
Category Address
13 -
Category Apps
114 -
Category Behavior Analysis
5 -
Category Calgary
21 -
Category Connectors
252 -
Category Data Investigation
79 -
Category Demographic Analysis
3 -
Category Developer
217 -
Category Documentation
82 -
Category In Database
215 -
Category Input Output
655 -
Category Interface
246 -
Category Join
108 -
Category Machine Learning
3 -
Category Macros
155 -
Category Parse
78 -
Category Predictive
79 -
Category Preparation
402 -
Category Prescriptive
2 -
Category Reporting
204 -
Category Spatial
83 -
Category Text Mining
23 -
Category Time Series
24 -
Category Transform
92 -
Configuration
1 -
Content
2 -
Data Connectors
982 -
Data Products
4 -
Desktop Experience
1,604 -
Documentation
64 -
Engine
134 -
Enhancement
406 -
Event
1 -
Feature Request
218 -
General
307 -
General Suggestion
8 -
Insights Dataset
2 -
Installation
26 -
Licenses and Activation
15 -
Licensing
15 -
Localization
8 -
Location Intelligence
82 -
Machine Learning
13 -
My Alteryx
1 -
New Request
226 -
New Tool
32 -
Permissions
1 -
Runtime
28 -
Scheduler
26 -
SDK
10 -
Setup & Configuration
58 -
Tool Improvement
210 -
User Experience Design
165 -
User Settings
85 -
UX
227 -
XML
7
- « Previous
- Next »
- abacon on: DateTimeNow and Data Cleansing tools to be conside...
-
 TonyaS
on:
Alteryx Needs to Test Shared Server Inputs/Timeout...
TonyaS
on:
Alteryx Needs to Test Shared Server Inputs/Timeout...
-
 TheOC
on:
Date time now input (date/date time output field t...
TheOC
on:
Date time now input (date/date time output field t...
- EKasminsky on: Limit Number of Columns for Excel Inputs
- Linas on: Search feature on join tool
-
MikeA
on:
Smarter & Less Intrusive Update Notifications — Re...
- GMG0241 on: Select Tool - Bulk change type to forced
-
Carlithian
on:
Allow a default location when using the File and F...
- jmgross72 on: Interface Tool to Update Workflow Constants
-
pilsworth-bulie
n-com on: Select/Unselect all for Manage workflow assets
| User | Likes Count |
|---|---|
| 7 | |
| 5 | |
| 3 | |
| 2 | |
| 2 |