on 05-08-201307:51 AM - edited on 07-27-202111:48 PM by APIUserOpsDM
The purpose of this process is to demonstrate the use of the bounding rectangle as a means of processing spatial data. For this illustrative example, our goal is to isolate the “Doughnut Hole”.
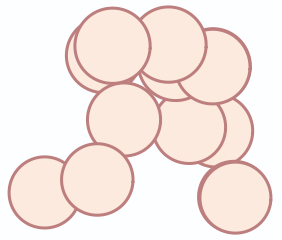
Image 1
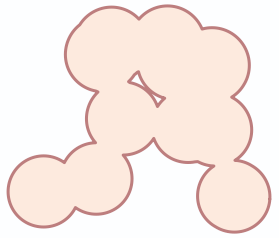
We begin areas. (image 1) Using the Summarize tool, we first combine our polygons, secondly, we generate the bounding rectangle.(images 2a, 2b) with some circular trade
Image 2a
Image 2b
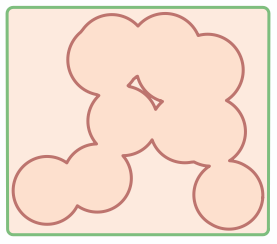
Using the Buffer tool, we create a buffer (any size >= 1) on the Bounding Rectangle.(image 3) Using the Poly Split tool, we split our spatial object to Regions. If we view the result in a table Browse, we see that there is a “Split_IsHole” field.(image 4)
Image 3
Image 4
We filter this field for True values and use a Select to view only the spatial object we want, the “doughnut hole”.(image 5)
Thank you for sharing. It would be great to have the original data to experiment with and understand the evolution / transformation of the data. For example: what's the first Select tool for? Parameters for the Sum tool, ...