Alteryx Designer Desktop Ideas
Share your Designer Desktop product ideas - we're listening!Submitting an Idea?
Be sure to review our Idea Submission Guidelines for more information!
Submission Guidelines- Community
- :
- Community
- :
- Participate
- :
- Ideas
- :
- Designer Desktop: New Ideas
Featured Ideas
Hello,
After used the new "Image Recognition Tool" a few days, I think you could improve it :
> by adding the dimensional constraints in front of each of the pre-trained models,
> by adding a true tool to divide the training data correctly (in order to have an equivalent number of images for each of the labels)
> at least, allow the tool to use black & white images (I wanted to test it on the MNIST, but the tool tells me that it necessarily needs RGB images) ?
Question : do you in the future allow the user to choose between CPU or GPU usage ?
In any case, thank you again for this new tool, it is certainly perfectible, but very simple to use, and I sincerely think that it will allow a greater number of people to understand the many use cases made possible thanks to image recognition.
Thank you again
Kévin VANCAPPEL (France ;-))
Thank you again.
Kévin VANCAPPEL
To get simple information from a workflow, such as the name, run start date/time and run end date/time is far more complex than it should be. Ideally the log, in separate line items distinctly labelled, would have the workflow path & name, the start date/time, and end date/time and potentially the run time to save having to do a calculation. Also having an overall module status would be of use, i.e. if there was an Error in the run the overall status is Error, if there was a warning the overall status is Warning otherwise Success.
Parsing out the workflow name and start date/time is challenge enough, but then trying to parse out the run time, convert that to a time and add it to the start date/time to get the end date/time makes retrieving basic monitoring information far more complex than it should be.
It would be useful to have the WorkflowName captured as one of the default Engine constants. The WorkflowDirectory is included so why not the WorkflowName as well?
I often have to use configuration files to pass in values to workflows meaning the workflow name needs to be manually entered into the workflow, either as a text input or User Constant, which feels like an unnecessary step as Alteryx must know the name of the workflow once it has been saved.
Ever since upgrade to version 10, when you highlight rows in a browse tool, it is almost impossible to see what is highlighted. Previously, I believe it was a shade of green which provided great contrast against the white background of the cells so you could easily see what you were highlighting. With version 10, it was moved to a very very light blue which almost looks white, so it is near impossible to tell which rows you're highlighting. I looked in the settings and do not see any way to change this.
Am myself and my colleagues alone in finding this very straining on the eyes? Would like to either be able to select what color you want in the settings, or move back to something easier to see.
Thanks.
Pretty much only time I add Browse tools during development now is to get access to the Cell Viewer to examine values better.
Would love to be able to do this on the output window
I think the scheduler should include another frequency otpion of every other week. Let's say I want a workflow to run every other Monday, there is currently no simple way to do this. There are some workarounds but they are not ideal and include some additional manual work which defeats the purpose of having the scheduler.
I saw this article (Oculus App Makes Programming Tangible To Non-Coders) and immediately thought of Alteryx.
How about a virtual reality based version where the user can be in the canvas and reach out and touch their data directly?
In a fututre release from SQL Server the datatypes text, ntext and image will be deprecated. It is already a bad datatype because you cannot use it as a "normal" character string. No equal to sometinh else in T-SQL on a text datatype.
As far as I know Alteryx defaults to text (my source is a PostgreSQL database) when creating the table in SQL Server. The datatype in Alteryx is Vstring. Instead of text or ntext it would be zo much better to use varchar(MAX) or nvarchar(MAX) when creating the table. Not only for compatiblity and later use in T-SQL (if any), but it is faster as well. Data from a varchar(MAX) column is stored in the same page as the record, as log as it fits.
When building out a large workflow, I'd say one of the bigger challenges I come across is being able to quickly navigate the canvas to a certain spot. In these types of workflows, my personal way of keeping things organized is creating sections of my workflow in different Tool Containers and naming them with a short description.
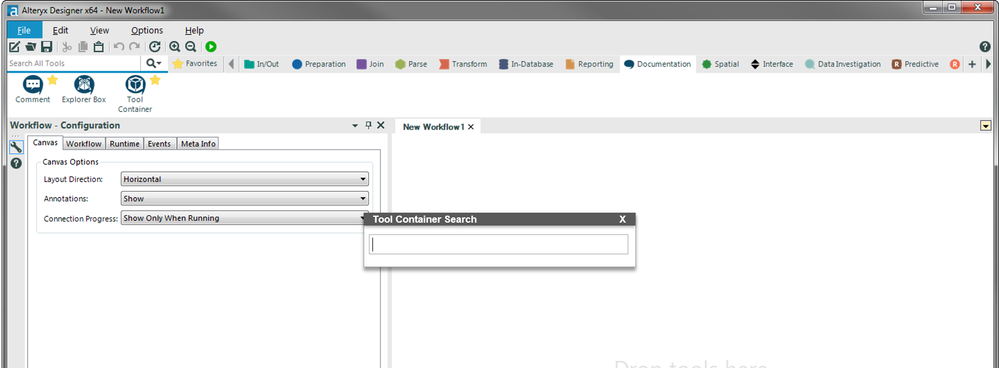
Here is what I picture helping out a great deal in navigation. Create a drowdown somewhere in the ribbon on top (would not want another sidebar or floating window that takes up needed space) that simply lists out every tool container in my workflow by name. When a tool container name is selected, the view jumps to that tool container in the window pane. Another option in terms of the interface might be to add a keyboard short that gives a popup "tool container search" window. Begin typing a tool container name, and it would jump to the first result it sees as a match. Then just hit escape or click outside the popup to continue your work.
I think this would help immensely in being able to jump to a particular spot in the workflow without having to drag the overview or scroll around until you are able to find it. I included mock-ups for each version I mentioned.

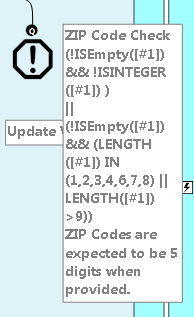
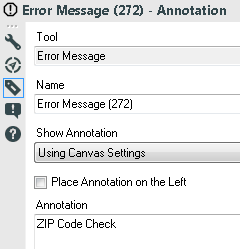
For example I have an ERROR MESSAGE tool that is rather verbose. I chose to modify the annotation as: ZIP Code Check. I presumed that the result would simply be "ZIP Code Check", but Alteryx added that to the beginning of the annotation rather than replacing the whole annotation. I reported this as a bug, but was told that this was designed to operate in this manner. It was suggested that I bring this out as a "New Idea" to the community for review. If you agree that the tools should operate in a similar fashion for annotation (or other actions) across the pallet, please STAR this. Otherwise, I'm happy to hear your feedback.
Thanks,
Mark
Hi,
Today I pressed F1 in the Output Tool to find out what the setting Transaction Size does. It turned out that this is not documented.
It would be a great idea to make a documentation that covers the options of a tool.
Regards,
Frank
The summarize tool have drag drop facility and cross checking and suggestion on the type of aggregation that can be applied based on the data type.
e.g. Let there be two different stack. One to be used for Group By. Another for aggregation.
We should be able to drag fields to these sections.
Now when we are dragging something to the Aggregation stack, based on the data type, a small suggestion list of possible aggregation to choose from.
And a small validation of the data type to aggregation if we are defining the aggregation manually.
I can provide mock ups if anyone is interested.
I love that Alteryx lends itself to good workflow documentation, but I'd really like to be able to add a bit of basic formatting within my comment boxes. I tend to have one large (read: verbose) box at the top/beginning of the workflow describing the purpose of the workflow and quirks of the datasource to watch out for, and it would be easier to read these if I had some simple options like Bold, Italic, Underline, numbered list, bullet list. You know, the sorts of things you can do in basic HTML email? Those. I want them!
There is currently no way to export interactive output from the network graph tool. I would like to be able to export a png of the static network graph image, a pdf of the report, and a complete html of the whole (which means including the JSON and vis.js files necessary for creating the report).
I think it would be extremely beneficial to have the customization option to rearrange tools within their panels in the tool palette.
This would allow the user to group frequently used tools in their desired order, which would make navigation of these tools easier.
As an example, having the ability to place Data Input as the first tool in the palette would make a lot of sense to me, as its usually where I start building a new workflow.
Can you devise a way to bring out the dynamic network visualisation on to Powerpoint. Right now, we can only see a static image on a browser
I found what I think is a bug. Usually the bug maker is me, but on this occasion I really think that it could be Alteryx (version 10.1.6.60263). Maybe we could add a category for posts as: Is this a bug? Currently, the idea labels allow for a "BUG". But is bug reporting really part of New Ideas?
I'm going to report my findings to clientservices@alteryx.com.
For those interested in what I'm observing:
Try creating a INTERFACE using an ERROR MESSAGE tool. Once you've got a formula and an error message, check the ANNOTATION. Do you see one on the canvas and do you see it in the configuration? Try putting a brief annotation into the Annotation box. I believe that the Annotation should appear in the annotation box as it does with other tools. Check the canvas and see what happens. Here's what mine looks like:
Hello all,
It will be great if there is an option to specify sql statement or delete based on condition in write In-DB tool. We have to delete all record even though when we are trying to delete and append only a subset of records. If it allows for "WHERE" statement atleast, it will be very much useful. I have a long post going on about this requirement in http://community.alteryx.com/t5/Data-Preparation-Blending/Is-there-a-way-to-do-a-delete-statement-in... .
Regards,
Jeeva.
I recently began working with chained analytic applications. One of the things that I wanted to do was to take the values selected by the end user at each stage of the app and pass them further down in the application. I was able to do this by dumping the selected values to Alteryx databases and then using drop downs to pull the data into subsequent apps. However, I was wondering if there would be a better way of accomplishing this. One reason is that, with my approach, I wind up with several additional drop downs in my interface--which I really don't want. If there's a way around this, I'd love to hear it. Alternately, if Alteryx could potentially support doing something like this in the future, I think it would be really helpful.
For the purposes of troubleshooting/optimization, it might come in handy to have a timestamp column in the Results Pane. Especially with processes time-consuming enough that I let them run in the background, I would like to know which steps are particularly time consuming, and seeing when the messages were generated would at least be a start.
I just noticed in a workflow I'm looking at, that I derived a column but after a bit of developing, forgot about it, so there it sat, unused. It doesn't hurt anything, but it would be useful if that sort of thing would automatically generate a soft warning on the tool in question: e.g. any item not referenced downstream automatically generates an "Unused variable" warning.
- New Idea 297
- Accepting Votes 1,790
- Comments Requested 22
- Under Review 168
- Accepted 54
- Ongoing 8
- Coming Soon 7
- Implemented 539
- Not Planned 111
- Revisit 59
- Partner Dependent 4
- Inactive 674
-
Admin Settings
20 -
AMP Engine
27 -
API
11 -
API SDK
222 -
Category Address
13 -
Category Apps
113 -
Category Behavior Analysis
5 -
Category Calgary
21 -
Category Connectors
247 -
Category Data Investigation
79 -
Category Demographic Analysis
2 -
Category Developer
211 -
Category Documentation
80 -
Category In Database
215 -
Category Input Output
646 -
Category Interface
241 -
Category Join
104 -
Category Machine Learning
3 -
Category Macros
153 -
Category Parse
76 -
Category Predictive
79 -
Category Preparation
395 -
Category Prescriptive
1 -
Category Reporting
199 -
Category Spatial
81 -
Category Text Mining
23 -
Category Time Series
22 -
Category Transform
89 -
Configuration
1 -
Content
1 -
Data Connectors
969 -
Data Products
3 -
Desktop Experience
1,554 -
Documentation
64 -
Engine
127 -
Enhancement
347 -
Feature Request
213 -
General
307 -
General Suggestion
6 -
Insights Dataset
2 -
Installation
24 -
Licenses and Activation
15 -
Licensing
13 -
Localization
8 -
Location Intelligence
80 -
Machine Learning
13 -
My Alteryx
1 -
New Request
206 -
New Tool
32 -
Permissions
1 -
Runtime
28 -
Scheduler
24 -
SDK
10 -
Setup & Configuration
58 -
Tool Improvement
210 -
User Experience Design
165 -
User Settings
81 -
UX
223 -
XML
7
- « Previous
- Next »
- Shifty on: Copy Tool Configuration
- simonaubert_bd on: A formula to get DCM connection name and type (and...
-
NicoleJ on: Disable mouse wheel interactions for unexpanded dr...
- haraldharders on: Improve Text Input tool
- simonaubert_bd on: Unique key detector tool
- TUSHAR050392 on: Read an Open Excel file through Input/Dynamic Inpu...
- jackchoy on: Enhancing Data Cleaning
- NeoInfiniTech on: Extended Concatenate Functionality for Cross Tab T...
- AudreyMcPfe on: Overhaul Management of Server Connections
-
AlteryxIdeasTea
m on: Expression Editors: Quality of life update
| User | Likes Count |
|---|---|
| 7 | |
| 4 | |
| 3 | |
| 3 | |
| 3 |


