Alteryx Designer Desktop Ideas
Share your Designer Desktop product ideas - we're listening!Submitting an Idea?
Be sure to review our Idea Submission Guidelines for more information!
Submission Guidelines- Community
- :
- Community
- :
- Participate
- :
- Ideas
- :
- Designer Desktop
Featured Ideas
Hello,
After used the new "Image Recognition Tool" a few days, I think you could improve it :
> by adding the dimensional constraints in front of each of the pre-trained models,
> by adding a true tool to divide the training data correctly (in order to have an equivalent number of images for each of the labels)
> at least, allow the tool to use black & white images (I wanted to test it on the MNIST, but the tool tells me that it necessarily needs RGB images) ?
Question : do you in the future allow the user to choose between CPU or GPU usage ?
In any case, thank you again for this new tool, it is certainly perfectible, but very simple to use, and I sincerely think that it will allow a greater number of people to understand the many use cases made possible thanks to image recognition.
Thank you again
Kévin VANCAPPEL (France ;-))
Thank you again.
Kévin VANCAPPEL
1. An ability to right click on a connection and disable it to prevent any processing beyond that connector.
2. An ability to right click and make a tool 'transparent' (on certain tools like filter, with perhaps icon color change to show it is transparent) to see what happens with/without that tool much further down the road in large workflows.
3. An ability to left click on empty space between tools and connectors (the background) and drag the workflow around for faster navigation in large workflows. I know that there is an overview feature for faster navigation, but this should add further ease in navigation process.
4. An ability to make container any shape (lasso-like) and not just rectangular. It would make for much clearer distinction between containers.
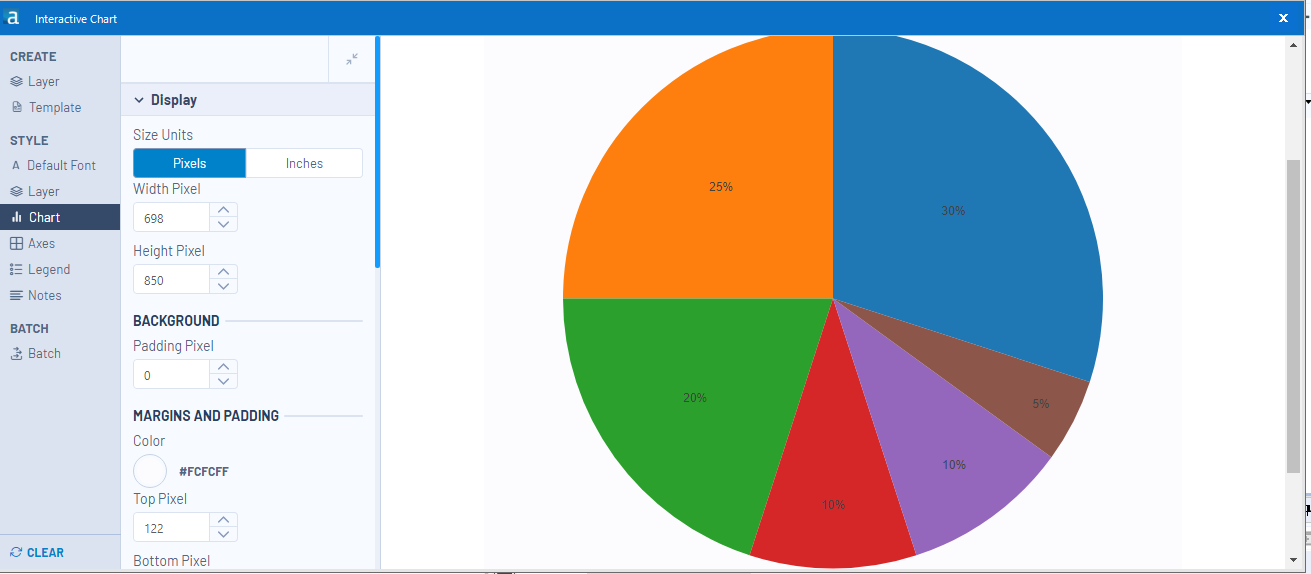
5. How about a 'done' button in the new interactive chart so I don't have to 'close'out of it? After making all the adjustments, having to 'close' the display is not very reassuring.
6. How about third dimension (for size) in the scatter tool?
I am not sure if some of the features I requested are already there, if so please point me in the right direction. I did try to search in ideas and community section, but wasn't able to pinpoint to any specific topics I bring up above.
I am using the 2018.3.5.52487 version.
-
Category Interface
-
Desktop Experience
-
Category Reporting
-
Desktop Experience
Can you please enable option to select multiple performance measures in AB Trend tool.
Currently we can only choose one metrics
-
Category Predictive
-
Desktop Experience
Hi,
Noticed an issue in the Browse tools, specifically if you’ve run a module once, where browse tools are displaying information, and then you add new browse tools into the process (without clicking run yet). What I’m seeing is if I’m looking at the “existing” Browse that is showing data, and then click directly onto a Browse tool that was added after the run (not remembering I just added it), the “new” Browse tool is showing the previous Browse tools info, I literally have to click on the canvas, and then back to the new Browse tool for Alteryx to recognized there isn’t any data to display in it yet. My point being it can be misleading to the user if they don’t recognize the wrong info is being displayed (because as you click back & forth between the two, the data stays the same, making the user think the issue is in the process rather than just the display, can waste a lot of time backtracking for no reason). I’ve seen this behavior over at least the past 3 engine updates, just FYI.
-
Category Interface
-
Category Preparation
-
Desktop Experience
Please add a tool to edit different cells in table randomly and update the source after editing. Similar to the "Edit Top 200 rows in SQL". That would be very much helpful
-
Category Data Investigation
-
Category Input Output
-
Data Connectors
-
Desktop Experience
When outputting to files in avro format, it would be nice to have Alteryx either throw an error/warning or automatically add a prefix when field names do not conform to the Apache Avro specifications. For example, if I were to try to output an .avro file with a field named "2018 actions", Alteryx could throw a warning/error to remind me to rename the field, or Alteryx could change the field name for me to something like "X2018_Actions".
-
Category Preparation
-
Desktop Experience
-
Feature Request
We are limited to vertical and horizontal flow charts.
Being able to move the green entrance and exit nodes to vertical or horizontal positioning in the same chart would aid creating more efficient flow layouts.
The developers should check out Factorio too. Quite a few idea in there on flow charting.
EG:

-
Category Interface
-
Desktop Experience
This is an interface issue but I wish Alteryx can allow user to scroll across the ribbon toolbar (e.g. In/Out, Prep, Join, Spatial tools...) when the toolbar is active.
That is, for example, when I click on "Transform" and notice my tool is not there, I can quickly scroll my mouse to move to other toolsets. Microsoft Office is a best practice for this and I think this will make it much efficient to locate tools.

-
Category Interface
-
Desktop Experience
For most of our "Production" mode, we launch our apps with an xml file containing the parameter send to the app.
We would like to have the path of this file in the Engine Constant.
-
Category Apps
-
Desktop Experience
When working on the Weekly Challenge #108, I was trying to design a non-macro solution.
I ended up settling on the Generate Rows tool and was trying to find a way to generate rows until I had reached or exceeded the maximum density, however, I ran into an issue where I'd always have one too few rows, since the final row I was looking for was the one that broke the condition I specified.
In order to get around this, I came up with the following solution:


Essentially, I just set my condition to twice that of the true threshold I was looking for. This worked because I was always doubling the current value in my Loop Expression, and so anything which broke the 'actual' condition I was looking for ([MaxDensity]), would necessarily also break the second condition if doubled again.
However, for many other loop expressions, this sort of solution would not work.
My idea is to include a checkbox which, when selected, would also generate the final row which broke the specified condition.
By adding such a checkbox, it would allow users to continue using the Generate Rows tool as they already do, but reduce the amount of condition engineering that users are required to do in order to get that one extra row they're looking for, and reduce the number of potentially unseen errors in their workflows.
-
Category Preparation
-
Desktop Experience
-
Feature Request
-
Tool Improvement
Hi,
I am sure that I can't be the only person that would be interested in an output tool that allows categorical fields on both axes. THis would allow you to visualise the following example and I would suggest that this was either similar to the heatmap with boxes or the colour / size of the entry was determined by a third numerical value - such as 'Confidence' from the table below. THere might be ways to extend the idea as well as having a fourth parameter that puts text in the box or another number but it would be useful and not too hard I am sure.
LHS | RHS | Support | Confidence | Lift | NA |
{Carrots Winter} | {Onion} | 5.01E-02 | 0.707070707 | 1.298568507 | 210 |
{Onion} | {Carrots Winter} | 5.01E-02 | 9.20E-02 | 1.298568507 | 210 |
{Carrots} | {Onion} | 4.39E-02 | 0.713178295 | 1.309785378 | 184 |
{Onion} | {Carrots} | 4.39E-02 | 8.06E-02 | 1.309785378 | 184 |
{Peas} | {Onion} | 3.20E-02 | 0.428115016 | 0.786253301 | 134 |
{Onion} | {Peas} | 3.20E-02 | 5.87E-02 | 0.786253301 | 134 |
{Bean} | {Onion} | 2.20E-02 | 0.372469636 | 0.68405795 | 92 |
{Carrots Nantaise} | {Onion} | 2.08E-02 | 0.483333333 | 0.88766433 | 87 |
Many thanks in advance for considering this,
Peter
-
Category Input Output
-
Category Reporting
-
Data Connectors
-
Desktop Experience
I am parsing retailer promotions and have two input strings:
1. take a further 10%
2. take an additional 10%
I am using the regex parse tool to parse out the discount value, using the following regex:
further|additional (\d+)%
When the input contains examples of both options (i.e 'further' and 'additional'), the tool only seems to parse the first one encountered.
E.g if I state the regex string as:
further|additional (\d+)%
It only parses line 1 above
And if I state the regex string as:
additional|further (\d+)%
It only parse line 2
-
Category Parse
-
Desktop Experience
Create a standardized Mailbox application that could bolt onto Alteryx Server, to handle incoming attachments from sources like a Service Desk (Service Now for example) and other applications.
Essentially anything that regularly exports data in the form of an emailed attachments to which Alteryx could, using a series of predefined user rules and a designated email address, put those attachments into various directories ready for processing by automated Alteryx workflows.
This would save a huge amount of time as people currently have to manually drag and drop files. At least the on board Alteryx designers here haven't been able to come with a solution. Would also save any messy programming around systems like Outlook and bending any security issues within those systems. Many, many other applications have this simple feature built in to their products, especially service desks. I believe there would be a huge benefit to this very simple bolt on.
Why do we need yxmd files? Why shouldn't the default be yxmz? The workflow logic is the same. If you don't add any interface tools it will run, and it you want to have a interface you can.
If you start off with an yxmd and then decide to make it an app you now have two files to worry about.
As a habit I no longer save things as yxmd. As soon as I start a new workflow I save it as an yxmz.
Thoughts?
-
Category Apps
-
Desktop Experience
It would be a huge time saver if you had an option to unselect the fields selected and select the fields not selected in the Select tool.
-
Category Preparation
-
Desktop Experience
Yes, I know, it's weird to have a situation where a decision tree decides that no branches should be created, but it happened, and caused great confusion, panic, and delay among my students.
v1.1 of the Decision Tool does a hard-stop and outputs nothing when this happens, not even the succesfully-created model object while v1.0 of the stool still creates the model ("O") and the report ("R") ... just not the "I" (interactive report). Using the v1.0 version of the tool, I traced the problem down to this call:
dt = renderTree(the.model, tooltipParams = tooltipParams)
Where `renderTree` is part of the `AlteryxRviz` library.
I dug deeper and printed a traceback.
9: stop("dim(X) must have a positive length")
8: apply(prob, 1, max) at <tmp>#5
7: getConfidence(frame)
6: eval(expr, envir, enclos)
5: eval(substitute(list(...)), `_data`, parent.frame())
4: transform.data.frame(vertices, predicted = attr(fit, "ylevels")[frame$yval],
       support = frame$yval2[, "nodeprob"], confidence = getConfidence(frame),
       probs = getProb(frame), counts = getCount(frame))
3: transform(vertices, predicted = attr(fit, "ylevels")[frame$yval],
       support = frame$yval2[, "nodeprob"], confidence = getConfidence(frame),
       probs = getProb(frame), counts = getCount(frame))
2: getVertices(fit, colpal)
1: renderTree(the.model)
The problem is that `getConfidence` pulls `prob` from the `frame` given to it, and in the case of a model with no branches, `prob` is a list. And dim(<a list>) return null. Ergo explosion.
Toy dataset that triggers the error, sample from the Titanic Kaggle competition (in which my students are competing). Predict "Survived" by "Pclass".
-
Category Predictive
-
Desktop Experience
Dear Team
If we are having a heavy Workflow in development phase, consider that we are in the last section of development. Every time when we run the workflow it starts running from the Input Tool. Rather we can have a checkpoint tool where in the data flow will be fixed until the check point and running my work flow will start from that specific check point input.
This reduces my Development time a lot. Please advice on the same.
Thanks in advance.
Regards,
Gowtham Raja S
+91 9787585961
-
Category Input Output
-
Category Preparation
-
Data Connectors
-
Desktop Experience
The error message is:
Error: Cross Validation (58): Tool #4: Error in tab + laplace : non-numeric argument to binary operator
This is odd, because I see that there is special code that handles naive bayes models. Seems that the model$laplace parameter is _not_ null by the time it hits `update`. I'm not sure yet what line is triggering the error.
-
Category Predictive
-
Desktop Experience
The CrossValidation tool in Alteryx requires that if a union of models is passed in, then all models to be compared must be induced on the same set of predictors. Why is that necessary -- isn't it only comparing prediction performance for the plots, but doing predictions separately? Tool runs fine when I remove that requirement. Theoretically, model performance can be compared using nested cross-validation to choose a set of predictors in a deeper level, and then to assess the model in an upper level. So I don't immediately see an argument for enforcing this requirement.
This is the code in question:
if (!areIdentical(mvars1, mvars2)){
        errorMsg <- paste("Models", modelNames[i] , "and", modelNames[i + 1],
                          "were created using different predictor variables.")
        stopMsg <- "Please ensure all models were created using the same predictors."
      }
As an aside, why does the CV tool still require Logistic Regression v1.0 instead of v1.1?
And please please please can we get the Model Comparison tool built in to Alteryx, and upgraded to accept v1.1 logistic regression and other things that don't pass `the.formula`. Essential for teaching predictive analytics using Alteryx.
-
Category Predictive
-
Desktop Experience
-
Tool Improvement
- New Idea 377
- Accepting Votes 1,784
- Comments Requested 21
- Under Review 178
- Accepted 47
- Ongoing 7
- Coming Soon 13
- Implemented 550
- Not Planned 107
- Revisit 56
- Partner Dependent 3
- Inactive 674
-
Admin Settings
22 -
AMP Engine
27 -
API
11 -
API SDK
228 -
Category Address
13 -
Category Apps
114 -
Category Behavior Analysis
5 -
Category Calgary
21 -
Category Connectors
252 -
Category Data Investigation
79 -
Category Demographic Analysis
3 -
Category Developer
217 -
Category Documentation
82 -
Category In Database
215 -
Category Input Output
655 -
Category Interface
246 -
Category Join
108 -
Category Machine Learning
3 -
Category Macros
155 -
Category Parse
78 -
Category Predictive
79 -
Category Preparation
402 -
Category Prescriptive
2 -
Category Reporting
204 -
Category Spatial
83 -
Category Text Mining
23 -
Category Time Series
24 -
Category Transform
92 -
Configuration
1 -
Content
2 -
Data Connectors
982 -
Data Products
4 -
Desktop Experience
1,605 -
Documentation
64 -
Engine
134 -
Enhancement
407 -
Event
1 -
Feature Request
218 -
General
307 -
General Suggestion
8 -
Insights Dataset
2 -
Installation
26 -
Licenses and Activation
15 -
Licensing
15 -
Localization
8 -
Location Intelligence
82 -
Machine Learning
13 -
My Alteryx
1 -
New Request
226 -
New Tool
32 -
Permissions
1 -
Runtime
28 -
Scheduler
26 -
SDK
10 -
Setup & Configuration
58 -
Tool Improvement
210 -
User Experience Design
165 -
User Settings
86 -
UX
227 -
XML
7
- « Previous
- Next »
- abacon on: DateTimeNow and Data Cleansing tools to be conside...
-
 TonyaS
on:
Alteryx Needs to Test Shared Server Inputs/Timeout...
TonyaS
on:
Alteryx Needs to Test Shared Server Inputs/Timeout...
-
 TheOC
on:
Date time now input (date/date time output field t...
TheOC
on:
Date time now input (date/date time output field t...
- EKasminsky on: Limit Number of Columns for Excel Inputs
- Linas on: Search feature on join tool
-
MikeA
on:
Smarter & Less Intrusive Update Notifications — Re...
- GMG0241 on: Select Tool - Bulk change type to forced
-
Carlithian
on:
Allow a default location when using the File and F...
- jmgross72 on: Interface Tool to Update Workflow Constants
-
pilsworth-bulie
n-com on: Select/Unselect all for Manage workflow assets
| User | Likes Count |
|---|---|
| 32 | |
| 6 | |
| 3 | |
| 3 | |
| 3 |