Alteryx Designer Desktop Ideas
Share your Designer Desktop product ideas - we're listening!Submitting an Idea?
Be sure to review our Idea Submission Guidelines for more information!
Submission Guidelines- Community
- :
- Community
- :
- Participate
- :
- Ideas
- :
- Designer Desktop: Hot Ideas
Featured Ideas
Hello,
After used the new "Image Recognition Tool" a few days, I think you could improve it :
> by adding the dimensional constraints in front of each of the pre-trained models,
> by adding a true tool to divide the training data correctly (in order to have an equivalent number of images for each of the labels)
> at least, allow the tool to use black & white images (I wanted to test it on the MNIST, but the tool tells me that it necessarily needs RGB images) ?
Question : do you in the future allow the user to choose between CPU or GPU usage ?
In any case, thank you again for this new tool, it is certainly perfectible, but very simple to use, and I sincerely think that it will allow a greater number of people to understand the many use cases made possible thanks to image recognition.
Thank you again
Kévin VANCAPPEL (France ;-))
Thank you again.
Kévin VANCAPPEL
I'd like to vote up this idea of having marketo input connector having access to extrac data from other objects outside leads.
Here is the latest Marketo Analytics resources that are available. Anybody else encounter this bottleneck when trying to source the data out of Alteryx?
Hello Alteryx Community,
I've recently started using Alteryx and one option on the Output Data tool I think that could be useful to others and myself is the option to choose: Append to an extract file (Create if does not exist). This is similar to the already existing Overwrite existing extract file (Create if does not exist) option.
My case for this is... I'm in the situation where I'm setting up a flow that I know from the offset is going to be a repeatable flow that is designed to build up data over time and so I will be running the Output Data tools in append mode. Except for the first run, I can't append to an extract that doesn't exist! The flow in question has over around 20 Output Data tools and while it wouldn't take terribly long to reconfigure after the initial run, it is a bit tedious. I think there is scope for my proposed option for being implemented either as a standalone option or to replace the current append option.
Example of my current flow:

Also, it would be nice to be able to use a json-file as input in a simple manner.
When I setup an In-DB connection I need a way to select only the tables I want to see. Basically a way to favorite the most frequenently used tables and also the ability to add a description of the information that resides in that table. Use Case: Because we have so many irrelevant tables with no data dictionary in some of our databases this would save a ton of time to narrow down the tables I can select right off the bat.
The new insight tool offers some great charting abilities but it does not integrate with other reporting tools. The tool doesn't support pictures,tables or any way to pull text from the data in the workflow in. This really prevents it from being a solution to any of the my reporting needs.
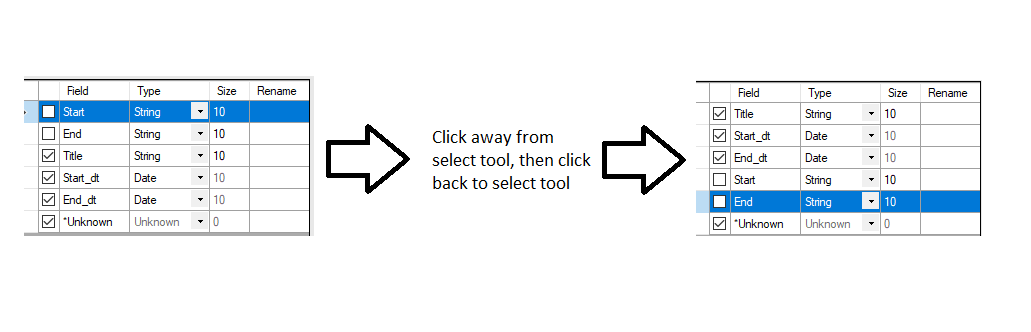
When using the 'Select' tool, often many columns are deselected, making it difficult to locate the remaining selected columns. It would save time to move deselected columns to the bottom of the ‘Select’ tool configuration after leaving the tool. Both selected and de-selected columns should retain their incoming field order within the group.

One of those small little annoyances that can add some extra time to development is how when you browse for a file (either with the Input Tool or Output Tool) it always defaults to the most recent location of where you either picked up a file or output a file.
Many times I have existing Input Tools or Output Tools that I simply need to repoint (meaning they already have a file location mapped to either read or write to.) For these, it would be great if, when the user clicked to File Browse, the initial folder location displayed was the same folder where the current file is mapped to.
Perhaps displaying the most recent folder in the file browse interface may be best suited for when a file has not been mapped yet.
After developing complicated workflows (using over 200 tools and over 30 inputs and outputs) in my DEV or QA environment, I need to switch over to Production to deploy it, but it's incredibly annoying to have to change 30 data inputs individually from QA to Prod, DEV to QA, etc. If I need to go back to QA to change something and re-test, I have to do it all again. etc.etc.
I need a way to be able to change mass amounts of data sources at once or at least make the process a lot more streamlined to make it bearable. Otherwise it is incredibly difficult to work within multiple environments.
Curl currently doesn't have Secure protocols supported. Please find below screen-shot. We are currently using Alteryx 11.7.6

Can Alteryx take this as feature request and add the secure libraries to existing cURL tool so that it can support the secure SFTP protocol.
In the Alteryx SharePoint list tool, Alteryx fails to authenticate using to connect to SharePoint list that is protected by ADFS. There Sharepoint sites outside of our company's firewall that use ADFS for authentication. We would like to connect to those sites via the Sharepoint List tool.
To track the problem down, I had to use the sample tool to grab x number of recs and see if it would run through the Tile tool. I had to keep skipping and selecting first N recs until I narrowed the problem down to 20 records. As it turned out. all values were 0 in a specific group. I found a workaround by pulling all recs per group with a value of 0 and bypassing these with the Tile tool. Instead of doing that - could you add an ExceptionHandler and specify which RecNo it crashed on?
Can you also add option to use 1, 2, or 3 std dev in addition to smart? This way all my groups will be uniform.
Was thinking with my peers at work that it might be good to have join module expanded both for desktop and in-database joins.
As for desktop join: left and right join shows only these records that are exclusive to that side of operation. Would it be possible to have also addition of data that is in common?
As for in-db join: db join acts like classic join (left with matching, right with matching data). Would it be possible to get as well only-left, only-right join module?
Adobe Illustrator file type. If this could be added as a Report Render output type, along with BMP, it would make the tool even more useful. Thanks!
Please have the Calgary Tools put the file names in the annotation automatically like all other input/output tools.
NOTE: There are other Idea posts for improvement of the Browse Profiling functionality, but I did not find anything specific to this and feel these ideas should be segregated anyway.
I just discovered that the plot in the Browse tool profiling section when plotting numeric values has differing behavior.
According to the documentation, "Once more than 10,000 unique values are profiled, binning is applied to increase performance and to represent data in a a more meaningful way."
What this means is that for numeric data, a scatterplot is shown if there are less than 10,000 unique values, and a frequency plot (bar chart) is shown if more than 10,000 unique values. There is then an indication that "Only the top 20 unique values are shown".
I can see where with some situations (e.g., an integer value), a frequency plot that shows the more predominant values would be a good thing to see.
However I would argue that a frequency plot of numeric data that is basically a “double” data type can be pretty meaningless…since out of 10,001 values, you might have 10,001 UNIQUE values…so you end up with a frequency plot that is not of much value (where as the scatterplot would still allow a user to see the dispersion of the ENTIRE data set).
I’ve attached an example to easily show this.
It would be great if the user could choose the plot he wants for a specific set of data…similar to the choices that occur when a date field is present in the data.
I came across the Find Replace Tool when I needed to find values from a column in one table in a column in another table. My first instance to solve the problem was to write a batch macro with a contains function in a formula followed by a not null filter (see attachment). This worked perfectly besides the fact that it was slow. Then I got excited when I discovered the Find Replace Tool accomplishes the same thing WAY faster, but I was wrong.
What I would love is the equivalent of an SQL query like this:
SELECT
A.1
B.1
FROM A
INNER JOIN
B
ON A.1 LIKE "%" || B.2 || "%"
which is a legal query in SQLite and is equal to the output of the attached macro. This is what I wish the Find Replace tool could do (Or a different tool), but it only finds one instance per "Find Within Field" value. The tools decision making doesn't line up with the decision-making that I need, for example it doesn't return the longest values found, instead the one with the first key to appear in the field. One way I've found to configure it better is to string a number of these together, that will give me a better result but still won't find every instance and uses 90 or so tools when I feel I should only need 1-3 to accomplish the same thing.
Instead of an Inner Join, the Find Replace is more like of Left Outer Join followed by a Unique() on A.1. Is there a way to accomplish this out-of-database in Alteryx?
I'm using .sv file format for compressing large files and using them in Alteryx. .sv is call a Alteryx Spatial Zip file. This format seems to offer the highest level of compression of all the Alteryx file format types. Is this suitable for text also? Is it usable in real time vs uncompressing first then using in a workflow? If not, I think a compressed real time file format would be a nice addition.
From a User Experience perspective it would be great if you could click in the expression box to write the filter rather than having to check the customer filter check box, or start by creating a basic filter and then make it more complex using the custom filter box without having to check the tick box.
Following on from this and something that is probably a lot harder to implement - But with the new basic filter, it would be great to have a list of available fields populate the options to filter by - Similar to the option that you get in Calgary. E.g Country == and then the drop down list would contain whatever is available in the data (e.g. Spain, UK, USA, Etc...)
- New Idea 266
- Accepting Votes 1,818
- Comments Requested 24
- Under Review 173
- Accepted 56
- Ongoing 5
- Coming Soon 11
- Implemented 481
- Not Planned 116
- Revisit 63
- Partner Dependent 4
- Inactive 674
-
Admin Settings
20 -
AMP Engine
27 -
API
11 -
API SDK
218 -
Category Address
13 -
Category Apps
113 -
Category Behavior Analysis
5 -
Category Calgary
21 -
Category Connectors
245 -
Category Data Investigation
76 -
Category Demographic Analysis
2 -
Category Developer
208 -
Category Documentation
80 -
Category In Database
214 -
Category Input Output
638 -
Category Interface
239 -
Category Join
102 -
Category Machine Learning
3 -
Category Macros
153 -
Category Parse
76 -
Category Predictive
77 -
Category Preparation
394 -
Category Prescriptive
1 -
Category Reporting
198 -
Category Spatial
81 -
Category Text Mining
23 -
Category Time Series
22 -
Category Transform
88 -
Configuration
1 -
Content
1 -
Data Connectors
959 -
Data Products
2 -
Desktop Experience
1,529 -
Documentation
64 -
Engine
126 -
Enhancement
322 -
Feature Request
213 -
General
307 -
General Suggestion
6 -
Insights Dataset
2 -
Installation
24 -
Licenses and Activation
15 -
Licensing
12 -
Localization
8 -
Location Intelligence
80 -
Machine Learning
13 -
My Alteryx
1 -
New Request
188 -
New Tool
32 -
Permissions
1 -
Runtime
28 -
Scheduler
23 -
SDK
10 -
Setup & Configuration
58 -
Tool Improvement
210 -
User Experience Design
165 -
User Settings
78 -
UX
222 -
XML
7
- « Previous
- Next »
- AudreyMcPfe on: Overhaul Management of Server Connections
-
 AlteryxIdeasTea
m on: Expression Editors: Quality of life update - StarTrader on: Allow for the ability to turn off annotations on a...
-
 AkimasaKajitani
on:
Download tool : load a request from postman/bruno ...
AkimasaKajitani
on:
Download tool : load a request from postman/bruno ...
- rpeswar98 on: Alternative approach to Chained Apps : Ability to ...
-
caltang
on:
Identify Indent Level
- simonaubert_bd on: OpenAI connector : ability to choose a non-default...
- maryjdavies on: Lock & Unlock Workflows with Password
- noel_navarrete on: Append Fields: Option to Suppress Warning when bot...
- nzp1 on: Easy button to convert Containers to Control Conta...
| User | Likes Count |
|---|---|
| 8 | |
| 8 | |
| 5 | |
| 5 | |
| 5 |