Alteryx Designer Desktop Ideas
Share your Designer Desktop product ideas - we're listening!Submitting an Idea?
Be sure to review our Idea Submission Guidelines for more information!
Submission Guidelines- Community
- :
- Community
- :
- Participate
- :
- Ideas
- :
- Designer Desktop: Top Ideas
Featured Ideas
Hello,
After used the new "Image Recognition Tool" a few days, I think you could improve it :
> by adding the dimensional constraints in front of each of the pre-trained models,
> by adding a true tool to divide the training data correctly (in order to have an equivalent number of images for each of the labels)
> at least, allow the tool to use black & white images (I wanted to test it on the MNIST, but the tool tells me that it necessarily needs RGB images) ?
Question : do you in the future allow the user to choose between CPU or GPU usage ?
In any case, thank you again for this new tool, it is certainly perfectible, but very simple to use, and I sincerely think that it will allow a greater number of people to understand the many use cases made possible thanks to image recognition.
Thank you again
Kévin VANCAPPEL (France ;-))
Thank you again.
Kévin VANCAPPEL
When I use the rectangular lasso to select some tools and/or control click them, I want to see a count of selected tools please.
Add input of ArcGrid file format.
Hi, I would like the ability to hover over a point/polygon on a Browse tool that displays geospatial data and be provided with some information on the data that isn’t currently offered. Namely, I would like the ability to hover over a point/centroid and have a bubble (a.k.a. tool tip) pop up displaying the exact coordinates of that datum, the row ID and some other unique identifying information (e.g. name, store number, etc). Other geospatial tools provide this functionality. See below:
Google Maps:

Alteryx:

And by the way, I realize Alteryx is not Google Maps, but as a data “consumer” or “interactor”, I think it’s just human nature for people to want them to “feel” the same. Something to strive for, at least.
I would also like the ability to click a datum displayed on the browse tool and have it highlight the row on the Results pane. The clicking functionality works going from the Results pane to the Browse tool, but not the other way.
Thanks! Kurt
When I use Alteryx with Git, I experience a strange bug. I have a workflow with a batch macro inside and the macro questions are mapped to fields. When I save and commit the workflow, the macro questions are not mapped for anyone else who opens that version. Every time that workflow is opened after a commit, we have to map the macro questions. Why does this happen and how can we resolve it? Thank you.
As the titles says, the move up/move down buttons from the select tool or a similar logic are not available yet.
It would come in handy to have this option when creating apps.
I want to create Descriptions for my fields in addition to those Alteryx auto creates, Text to Columns tool for example. I want to load these descriptions automatically into Tableau Hyper files so when I use the Tableau describe field feature, I will see them there. It also sets up the potential to create a data dictionary in the Tableau workbook based on these descriptions. Please give the option to load field descriptions into Tableau hyper files. Thank you.
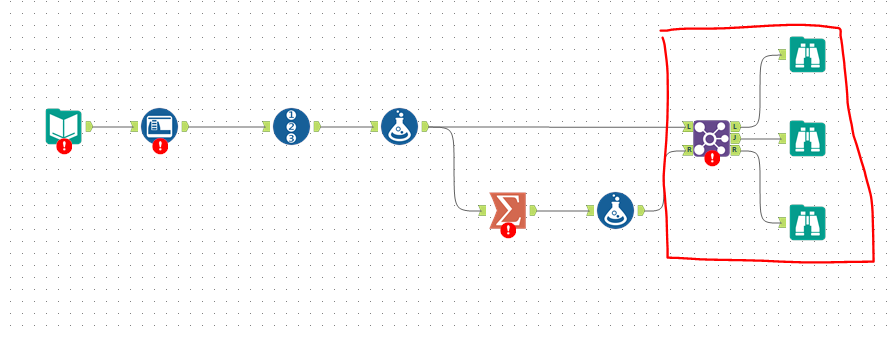
When models are complex and extensive, it can be difficult to locate specific sections of a workflow despite any effort to organize the tools. I believe that it would be beneficial to have a feature that saves focused views of the model, e.g. zoomed into a specific location or set of tools, with a configuration of expanded or contracted containers.
The intent would not to affect the data flow but rather facilitate the data analyst's movement within the file.
Please see the (simple) example below, where the zone if red could be a saved view, onto which the screen would zoom and shift when selected.
I would like to be able to have the Map Tool to change the Reference Base Map to Tom Tom CA if there is a Country column in the incoming data stream that reads "CAN". Or change the Expand Extent from the default 10(%) to the number that's in a column called "Extent".
Right now I can only do it using the Macro interface tool, but I still have to make my selection after I select which data point(s) I'm using.
I want it to generate specific-format maps based on the input data I provide, so it could run automatically.
I guess, aside from the Spatial Field, Grouping Field, Thematic Field, and Label Fields, I'd love a Configurations Field(s).
I work for a company that is still running v 10.5. It takes some time for us to go through acceptance testing / approval for new versions of software, and therefore we will only upgrade to version 11 in November at the earliest. At the moment there is a warning just above the workflow stating that a newer version of Alteryx designer is available, which decreases the size of the workflow canvas etc. There is a dropdown to to defer this warning for a period of time (90 days/1 year etc), but this appears to make no difference as the warning shows on every startup of Alteryx. It would be great for this warning to be removed/the deferral to actually work as it becomes old pretty quickly when I have to remove this warning on every startup.
Thanks!
I would like to see an included select window for (nearly) all tools. Sometimes almost half of my workflow are select tools because I try to minimize my data and improve naming as much as possible.
Example:

1) Removing unnecessary columns
2) Removing Lat/Long columns
3) Removing not needed columns from distance tool.
Another example would be the typical usage of cross-tab. In 90% of my cross-tab usage, I put a select tool behind it.
I think it would be good to have an included select window in nearly all tools. There are probably tools that don't need them, but I think it would be a good addition to many tools.
I would suggest to add an included select tool for (at least) these tools:
- Input Data
- Cross-tab
- Tile
- Formula
- Multi-Row Formula
- Multi-Field Formula
- Text To Columns
- Cross Tab
- Transpose
- Create Points
- Distance
- Trade Area
- ...
For example, allowing the letters in front of the column titles to be formatted differently to make them stand out on a report.
When using the equal sum option in the Tile tool, you have the choice to sort by a column. However, it's not clear from the tool whether the data is being sorted in ascending or descending order.
Confusingly, the data is sorted in descending order, compared to the default of ascending in the Sort tool. This seems counterintuitive, as a user would expect the same defaults across tools (we did! and it caused some consternation when we worked out it wasn't) and also because in most of our use cases, you want the highest tile to be the highest rank, e.g., if you were sorting households by income.
I have two possible suggestions:
1. Update the tool properties so that it reads "Sort column (descending)". (Probably the easiest change!)
2. Allow the user to specify a direction with another drop down that becomes active when you select a sort field (similar to the sort tool).
I know that the functionality of suggestion 2 is available by adding a Sort tool before the Tile and sorting the data in ascending order. However, having to do that every time seems to defeat the point of being able to sort in the Tile tool.
Thanks for reading!
Jason
Standard Tile configuration:

Option 1 (mock-up):

Option 2 (mock-up):

Hello,
I am using google analytics connector (v7.0.7) with alteryx designer version 2019.4. I am using online option to sign in and able to extract required dimensions and metrics but when it gets disconnected, I have to select everything again.
That would be very helpful if I can simply save my settings with selected dimensions, metrics and segments etc.
Thanks
I would love to see an optional output anker for the render tool.
This would allow us to push a pdf/png into the python module. We could then build twitter/social media 'add ons' using python and fully automize the process.
Hi
1:
I'm from Denmark, and like several other european countries we use commas instead of dot as decimal seperator. And we use dot as thousand seperator.
So if im working in a flow with loads of price fields, lets say cost price, amount per unit, amount and amount including vat i need to do a multi field replace. Else I dont get the output i can work with in excel or other programs.
So it would be great beeing able to set seperators on a flow level, like you can in excel when importing.
2.
Beeing able to set a date format on a flow level.
Lets say my input data is 12.12.2019 and i need 2019-12-12 in my output. If i work with several different date fields i need to use several datetime fields.
Alternate could be a multi field datetime ?
3.
Having a search function when using the select ? And maybe a numbers order.
So if i scroll down, i could enter 3 - which means this would now be my 3. shown field?
A great feature would be for CASS to provide the address type as Residential or Business. Better yet, further breakdown of address type into single-family, apartment, retail, office, commercial, warehouse, etc. This would be very beneficial when analyzing address data from the Tom Tom Address Points Calgary database and can allow a end-user to filter prioritize addresses in their analysis based on the type of address.
Has anyone tried to build a flow that goes from right to left?
If possible, it would be very helpful if the Schedule Workflow window that a user activates to schedule a workflow on the server showed which version is currently running on the server. This will help avoid the version incompatibility issues when a user has upgraded to a higher version than is currently running on the server. Also, for companies that have just started using a server and all the version control processes and guidelines and not yet in place this would be very helpful. Thanks for the consideration.
The performance profile option outputs a list into the results window. It is difficult to check the tools and continuously scan back to the profile. Make it easy! Put the times and percentages in the connection progress tooltips of all the tools.
Slightly off the track, but definitely needed...
I'd like like to propose a novel browsing.
With this new feature you may no longer require the traditional Browse Tool, to the extent that it may be decommissioned later. Here's how new Browse would work.
So far Browse Tool is helpful for mid-stream data sanity check...
But a complex workflow will need so many Browse Tools, thereby wasting a lot of canvas space and unnecessarily complicating / slowing the workflow further.

Expected Browse:
Clicking on any tool should automatically populate its results in the Results window without the need of Browse Tool.
1) Tools with a single output: Clicking on the tool or its output plug should reveal its data (ex: Summarize Tool)
2) Tools with more than one output: Clicking on each of the output plug should reveal its data (ex: Join)

BONUS: Clicking on the input plug of a tool should reveal its input data

- New Idea 317
- Accepting Votes 1,790
- Comments Requested 22
- Under Review 171
- Accepted 54
- Ongoing 8
- Coming Soon 7
- Implemented 539
- Not Planned 110
- Revisit 57
- Partner Dependent 4
- Inactive 674
-
Admin Settings
21 -
AMP Engine
27 -
API
11 -
API SDK
223 -
Category Address
13 -
Category Apps
113 -
Category Behavior Analysis
5 -
Category Calgary
21 -
Category Connectors
247 -
Category Data Investigation
79 -
Category Demographic Analysis
2 -
Category Developer
212 -
Category Documentation
80 -
Category In Database
215 -
Category Input Output
646 -
Category Interface
242 -
Category Join
105 -
Category Machine Learning
3 -
Category Macros
154 -
Category Parse
76 -
Category Predictive
79 -
Category Preparation
398 -
Category Prescriptive
1 -
Category Reporting
200 -
Category Spatial
82 -
Category Text Mining
23 -
Category Time Series
22 -
Category Transform
91 -
Configuration
1 -
Content
1 -
Data Connectors
969 -
Data Products
3 -
Desktop Experience
1,569 -
Documentation
64 -
Engine
129 -
Enhancement
362 -
Feature Request
213 -
General
307 -
General Suggestion
6 -
Insights Dataset
2 -
Installation
25 -
Licenses and Activation
15 -
Licensing
14 -
Localization
8 -
Location Intelligence
81 -
Machine Learning
13 -
My Alteryx
1 -
New Request
212 -
New Tool
32 -
Permissions
1 -
Runtime
28 -
Scheduler
25 -
SDK
10 -
Setup & Configuration
58 -
Tool Improvement
210 -
User Experience Design
165 -
User Settings
82 -
UX
223 -
XML
7
- « Previous
- Next »
- asmith19 on: Auto rename fields
- Shifty on: Copy Tool Configuration
- simonaubert_bd on: A formula to get DCM connection name and type (and...
-
 NicoleJ
on:
Disable mouse wheel interactions for unexpanded dr...
NicoleJ
on:
Disable mouse wheel interactions for unexpanded dr...
- haraldharders on: Improve Text Input tool
- simonaubert_bd on: Unique key detector tool
- TUSHAR050392 on: Read an Open Excel file through Input/Dynamic Inpu...
- jackchoy on: Enhancing Data Cleaning
- NeoInfiniTech on: Extended Concatenate Functionality for Cross Tab T...
- AudreyMcPfe on: Overhaul Management of Server Connections
| User | Likes Count |
|---|---|
| 11 | |
| 8 | |
| 4 | |
| 4 | |
| 3 |