Alteryx Designer Desktop Ideas
Share your Designer Desktop product ideas - we're listening!Submitting an Idea?
Be sure to review our Idea Submission Guidelines for more information!
Submission Guidelines- Community
- :
- Community
- :
- Participate
- :
- Ideas
- :
- Designer Desktop: New Ideas
Featured Ideas
Hello,
After used the new "Image Recognition Tool" a few days, I think you could improve it :
> by adding the dimensional constraints in front of each of the pre-trained models,
> by adding a true tool to divide the training data correctly (in order to have an equivalent number of images for each of the labels)
> at least, allow the tool to use black & white images (I wanted to test it on the MNIST, but the tool tells me that it necessarily needs RGB images) ?
Question : do you in the future allow the user to choose between CPU or GPU usage ?
In any case, thank you again for this new tool, it is certainly perfectible, but very simple to use, and I sincerely think that it will allow a greater number of people to understand the many use cases made possible thanks to image recognition.
Thank you again
Kévin VANCAPPEL (France ;-))
Thank you again.
Kévin VANCAPPEL
When you add a tool in the canvas, the annotation is automatically set (for example the formula, or connection configuration etc). You can then customize the annotation text in the "Annotation" tool's tab. But sometimes it can be useful to revert to the "automatic" annotation, and it doesn't seem possible once you set it to something different.
Apparently there is currently no way to reset a tool's annotation text to the automatic value.
I've found a way to do it by editing the xml content of the file : as far as I know you just have to delete the <AnnotationText>[...]</AnnotationText> tag and reload the file, and the annotation gets back to the default "automatic" value, which is still present in the <DefaultAnnotationText> tag.
I think a simple button in the tool's annotation tab to reset it would be nice.
Thank you!
-
Tool Improvement
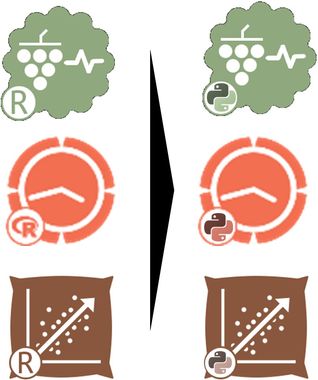
R and Python has a very fruitful competition in machine learning circles...
Why not have the python editions of all predictive tools as well so that
we can have an "all R", "all Python" and "R and Python" predictive tools that can be mixed and matched in a single workflow,
a multilingual approach...
-
Tool Improvement
I am currently building workflows on unfamiliar data and using the filter tool on text fields regularly on a large excel file.
As there is no dropdown on the right hand side of the filter tool I find myself needing to open excel and use it's dropdown functionality to find the right text to filter on. I know I could use the summarise tool but each time I run the workflow it takes many seconds to complete before it is populated. It is quicker to use Excel. I am surprised this has not been requested before.
-
Tool Improvement
-
Tool Improvement
Hi,
I was told this feature is working as intended/designed, so I decided to post an idea to see if there was interest in the feature I'm looking for.
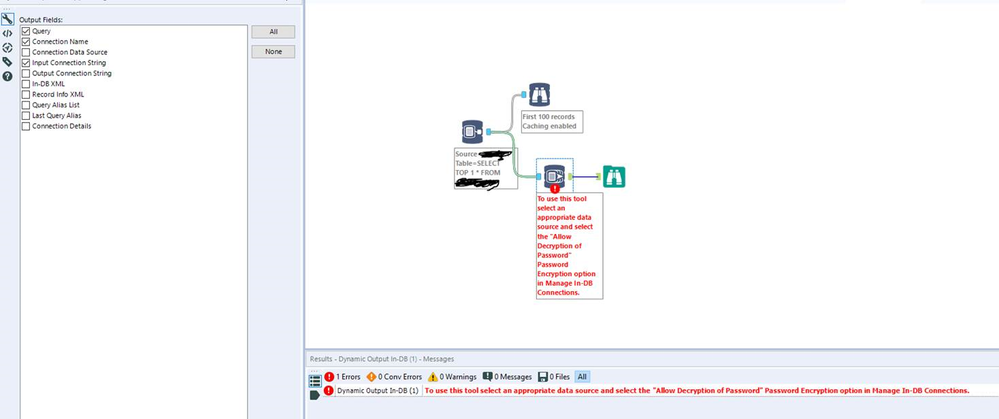
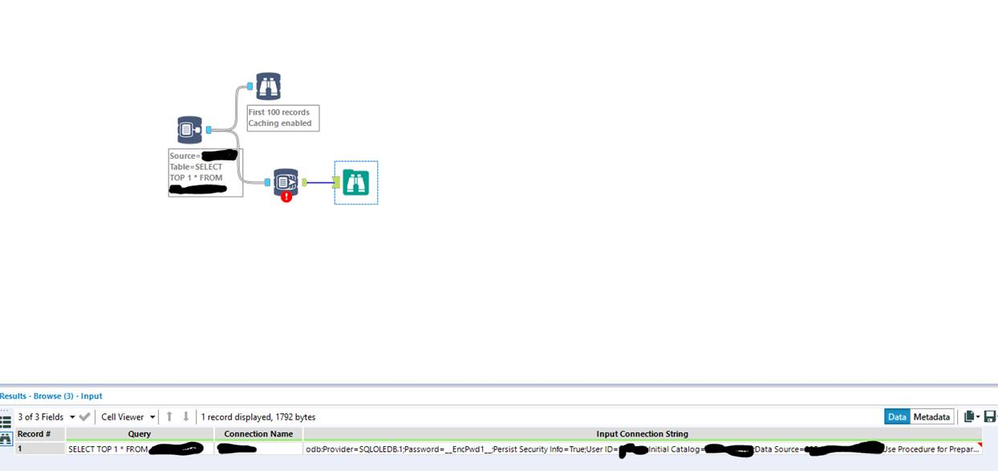
In debugging a workflow that another Alteryx user at my company was developing, we realized that an in-db connection was inadvertently pointing to the wrong environment. Because of how in-db tools output messages, there wasn’t anything visual pointing to this as an issue without manually inspecting the connection in “Manage In-DB Connections”. Since I’ve encountered some challenges with In-DB connections before, I suggested using the Dynamic Output In-DB tool, which I’ve used before for the “Input Connection String” option.
What I had never done before, and didn’t realize until I tested this, was use this with a connection that leverages an embedded SQL Server account username/password. When using this type of connection, an error is thrown that says: “ Dynamic Output In-DB (1) To use this tool select an appropriate data source and select the "Allow Decryption of Password" Password Encryption option in Manage In-DB Connections.”. However, the tool still works and appropriately pulls the connection as it exists.
For security reasons, we don’t want decrypted passwords floating around in this information, and we can’t enable “allow decryption of password” in our server environment.
So, my request would be to either add logging to In-Database tools to pass the connection string information (similar to regular input tools), or to add a method for outputting a connection string without a decrypted password that doesn't cause an error in Alteryx.
Screenshots below for reference.
-
Category In Database
-
Data Connectors
-
Feature Request
-
Tool Improvement
I installed version 4.0.0 of the Salesforce Input tool since the old tool is deprecated. When I open a saved workflow that has Salesforce inputs, the inputs display an immediate error, for example "Error: Salesforce Input (95): 401 Client Error: Unauthorized for url: https://servings.my.salesforce.com/services/data/v42.0/sobjects/Task/describe/". The workflow will not run until I click into each Salesforce input and then click outside of it again to make it refresh, which takes a few seconds each time. I'm guessing this has to do with Alteryx saving an expired OAuth access token and trying to pull updated metadata.
-
Category Connectors
-
Category Input Output
-
Data Connectors
-
Tool Improvement
It seems that currently the Python tool is raising a `FileNotFoundError` exception in Python when there is not data incoming on an input connection. I have, for example, a Filter tool before the Python tool and sometimes there is just no data coming to Python tool - as it is intended.
Unfortunately, the Python tools gives my an error message in those cases with this message before the error:
This is only the case when there is no data incoming. In all other cases, the tool works fine.
Since this is not really an error, a way to either catch this before using `Alteryx.read("#1")` or just having `Alteryx.read()` return an empty data.frame (as I would expect it to do) would be appreciated.
-
API SDK
-
Category Developer
-
Tool Improvement
When I perform data type conversions I sometimes receive conversion errors. There is not a slick way to programmatically handle these that I am aware of. Instead, I have to manage them with half a dozen tools or really unsightly expressions in formula tools. As an example, I have a string field with a value "two" and I want to convert to a decimal or int. I receive a conversion error and the value is either "0.000" or "0". This is clearly wrong and I want to have a NULL value instead. I want to use a function to attempt the conversion in the formula tool so i can nest it inside conditionals in a cleaner fashion.
Here is a reference to the try_cast doc:
https://docs.microsoft.com/en-us/sql/t-sql/functions/try-cast-transact-sql?view=sql-server-2017
-
Category Preparation
-
Desktop Experience
-
Feature Request
-
Tool Improvement
When using the latest version of PublishtoPowerBI and attempting to publish on the gallery the password encryption appears to be specific to the machine where the workflow resides.
It only works when the workflow is published from Designer on the Worker server. This is currently a limitation of the tool as confirmed by Alteryx on INC Case # 00261086.
Alteryx support also flagged that Refresh Token authentication type does not work on a Gallery. Authenication type Persist credentials should be used when publishing on the Gallery.
Could you please implement a solution so that we can use this tool when publishing to gallery?
-
Tool Improvement
There should by a Python Tool that is just a code paste (more like the R tool) and allows selection/packaging of venvs, similar to an IDE or we should be able to package scripts with workflows/macros.
A python tool that is easily integrated into macros for powerful and quick custom tools while avoiding Jupyter's failures would be incredibly beneficial. This would highlight how Python and Alteryx can work together, and don't need to be all or nothing competitors in the ETL space.
Jupyter is not a tool that should be used for production level processes - it is for teaching. Nobody has airflow or Luigi spinning up Jupyter and executing code in their ETL pipeline, so our Workflows shouldn't either. Yes, yes I have used to SDK to work around and I have also run scripts from the cmd tool but the first solution is time consuming and imposes a high skill wall and the latter has a lot of moving, non-packaged parts.
You guys have the API to do this and venv management from the SDK already so I don't think it would be expensive to implement.
-
SDK
-
Tool Improvement
Hi,
I did do some searching on this matter but I couldn't find a solution to the issue I was having. I made a Analytic App that the user can select columns from a spreadsheet with 140+ columns. This app looks at the available columns and dynamically updates the list box every time it is run. I wanted users to use the built in Save Selection they don't have to check each box with the columns they want every time they run it. However I seem to have found an issue with the Save Selection option when the Header in the source has a comma in it e.g. "Surname, First Name".
As the saved YXWV file seems to save the selection in a comma delimited way but without " " around the headers. So as you can see in my example below when you try and load this again Alteryx appears unable to parse the values as it thinks "Surname" and "First Name" are separate values/fields and not "Surname, First Name" and doesn't provide an error when it fails to load the selection.
Last Name=False,First Name=False,Middle Name=False,Surname, First Name=False,
So perhaps the Save Selection when writing the file can put string quotes round the values to deal with special characters in the Selections for the List Box. I have made a work around and removed special characters from the header in my source data but its not really ideal.
Thanks,
Mark
-
Category Interface
-
Desktop Experience
-
General
-
Tool Improvement
Hey everyone,
I'd like to suggest making use of Windows Taskbar progress feature to highlight running workflow status, it would be helpful for when you start a workflow and continue working on another application.
I made a workaround tool I append at the end of my workflows alongside with output tools to do the same thing, having the feature natively in the designer would be better.
the tool doesn't take care of other running workflows or different alteryx windows, it can't detect warnings and errors from other tools, although Alteryx Engine API might be better for this implementation, a quick python one is done for demo purposes.
Attached are the tool and a test workflow to demonstrate the feature, all the best.
-
General
-
Tool Improvement
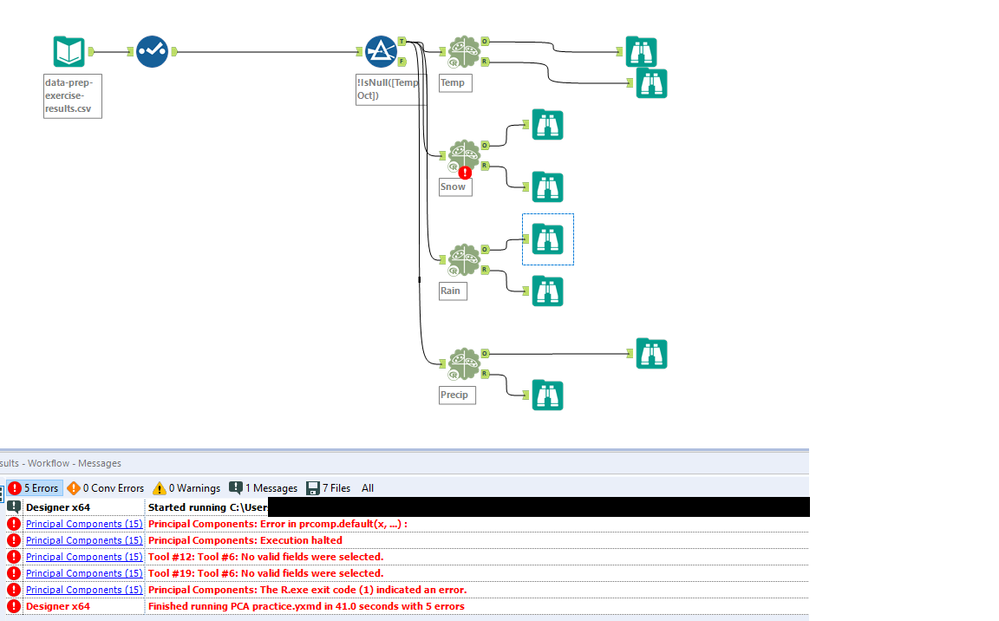
I would like to share some feedback regarding the Principal Component tool.
I've selected the option "Scale each field to have unit variance" and 1 of the 4 PCA tools was displaying errors. However, the error message is not very intuitive and I couldn't use it to debug my workflow. The problem was that for my type of data, scaling could not be applied since it had a lot of 0 values.
Couldn't find anything related to this, so hope my feedback helps others.
Thanks!
-
Category Predictive
-
Desktop Experience
-
Tool Improvement
In a short workflow, this might not be necessary as the information related to each tool is spelled out in the progress windows. However, in a complicated and lengthy workflow, tracing such msg can be a tedious task. In addition, using a tool with multiple outputs and only one output is selected while the residual outputs may be used to validate the result in the selected output; for example, joint tool where left or right output should be zero, a visual queue could be a quick way to alert operator on any potential problem. Certainly, a browse tool can be added but in a big workflow, couple with a large data set, it might be a drain to the system resource. What if there is a tool that would activate a visual alert, like a light bulb, based on a preset condition to tell user that something is wrong and perhaps additional work needs to be done to either remedy or to account for the residual data. As in the case of a joint where 100% match is desired, any unmatched row would require an update to the reference list which maybe an additional adhoc process outside the current process. Certainly, an additional steps can be added to first explore the possibility of unmatched data and to update the reference list accordingly. The workflow would in hold until 100% match is achieve. This would require additional system resource in order to hold; especially with large set of data and lengthy workflow. If the unmatched situation rarely occurs, just a lightweight visual queue that 'pop' while allow the process either to break or to go through might be a sensible solution. Just a thought.
-
Feature Request
-
New Tool
-
Tool Improvement
Bring back the Cache checkbox for Input tools. It's cool that we can cache individual tools in 2018.4.
The catch is that for every cache point I have to run the entire workflow. With large workflows that can take a considerable amount of time and hinders development. Because I have to run the workflow over and over just to cache all my data.
Add the cache checkbox back for input tools to make the software more user friendly.
-
Tool Improvement
The "Manage Data Connections" tool is fantastic to save credentials alongside the connection without having to worry when you save the workflow that you've embedded a password.
Imagine if - there were a similar utility to handle credentials/environment variables.
- I could create an entry, give it a description, a username, and an encrypted password stored in my options, then refer to that for configurations/values throughout my workflows.
- Tableau credentials in the publish to tableau macro
- Sharepoint Credentials in the sharepoint list connector
- When my password changes I only have to change it in one place
- If I handoff the workflow to another user I don't have to worry about scanning the xml to make sure I'm not passing them my password
- When a user opens my workflow that doesn't have a corresponding entry in their credentials manager they would be prompted using my description to add it.
- Entries could be exported and shared as well (with passwords scrubbed)
Example Entry Tableau:
| Alias | Tableau Prod |
| Description | Tableau Production Server |
| UserID | JPhillips |
| Password | ********* |
| + |
Then when configuring a tool you could put in something like [Tableau Prod].[Password] and it would read in the value.
Or maybe for Sharepoint:
| Alias | TeamSP |
| Description | Team sharepoint location |
| UserID | JPhillips |
| Password | ********* |
| URL | http://sharepoint.com/myteam |
| + |
Or perhaps for a team file location:
| Alias | TeamFiles |
| Description | Root directory for team files |
| Path | \\server.net\myteam\filesgohere |
| + |
Any of these values could be referenced in tool configurations, formulas, macro inputs by specifying the Alias and field.
-
Feature Request
-
General
-
Tool Improvement
In the Configuration section of the Formula tool, the “Output Column” area is resizable. However, it has a limit that needs to be increased. Several of the column names I work with are not clearly identifiable with the current sizing constraint. I do not think the sizing needs to be constrained.
-
Tool Improvement
I have a process that sends out about 1,500 emails. Every once in a while, it will get stuck at some Percentage and I will have to eventually cancel the workflow, figure out how many emails were sent, and then skip that many emails in order to avoid sending duplicate emails. The process of figuring out how many were sent is currently taking the % of the tool at cancellation minus 50%(since that is where it starts), Multiplying it by 2, and then multiplying that % by the number of lines to get the approximate line of data where it froze up, and then reaching out to individuals to see if they received the email to narrow down exactly where the error occurred.
Example: 60% - 50%= 10% * 2 = 20% * 1249 = 249.8.
This has been pretty accurate in the past, but obviously is not ideal. Is there no way for it to show us how many were sent even if we cancelled the workflow mid processing of the tool?
-
Category Reporting
-
Desktop Experience
-
General
-
Tool Improvement
The older versions of the Publish to Tableau Server Macro had an option to Request an authentication token however the latest version does not. Please return this option to the tool as it is very useful for constructing Rest API call scripts.
Thank you!
~ Eric Marowitz
-
Tool Improvement
Please allow a hover over that would show you the value of a variable in the formula tool. At times I get long formulas and it would be nice to see the values of each variable by just putting your mouse on top of it. Just show the first row like the preview. There is similar functionality in visual studio and it makes coding easier.
-
Feature Request
-
Tool Improvement
- New Idea 291
- Accepting Votes 1,790
- Comments Requested 22
- Under Review 167
- Accepted 55
- Ongoing 8
- Coming Soon 7
- Implemented 539
- Not Planned 111
- Revisit 59
- Partner Dependent 4
- Inactive 674
-
Admin Settings
20 -
AMP Engine
27 -
API
11 -
API SDK
220 -
Category Address
13 -
Category Apps
113 -
Category Behavior Analysis
5 -
Category Calgary
21 -
Category Connectors
247 -
Category Data Investigation
79 -
Category Demographic Analysis
2 -
Category Developer
209 -
Category Documentation
80 -
Category In Database
215 -
Category Input Output
645 -
Category Interface
240 -
Category Join
103 -
Category Machine Learning
3 -
Category Macros
153 -
Category Parse
76 -
Category Predictive
79 -
Category Preparation
395 -
Category Prescriptive
1 -
Category Reporting
199 -
Category Spatial
81 -
Category Text Mining
23 -
Category Time Series
22 -
Category Transform
89 -
Configuration
1 -
Content
1 -
Data Connectors
968 -
Data Products
3 -
Desktop Experience
1,551 -
Documentation
64 -
Engine
127 -
Enhancement
343 -
Feature Request
213 -
General
307 -
General Suggestion
6 -
Insights Dataset
2 -
Installation
24 -
Licenses and Activation
15 -
Licensing
13 -
Localization
8 -
Location Intelligence
80 -
Machine Learning
13 -
My Alteryx
1 -
New Request
204 -
New Tool
32 -
Permissions
1 -
Runtime
28 -
Scheduler
24 -
SDK
10 -
Setup & Configuration
58 -
Tool Improvement
210 -
User Experience Design
165 -
User Settings
81 -
UX
223 -
XML
7
- « Previous
- Next »
- Shifty on: Copy Tool Configuration
- simonaubert_bd on: A formula to get DCM connection name and type (and...
-
NicoleJ on: Disable mouse wheel interactions for unexpanded dr...
- haraldharders on: Improve Text Input tool
- simonaubert_bd on: Unique key detector tool
- TUSHAR050392 on: Read an Open Excel file through Input/Dynamic Inpu...
- jackchoy on: Enhancing Data Cleaning
- NeoInfiniTech on: Extended Concatenate Functionality for Cross Tab T...
- AudreyMcPfe on: Overhaul Management of Server Connections
-
AlteryxIdeasTea
m on: Expression Editors: Quality of life update
| User | Likes Count |
|---|---|
| 5 | |
| 3 | |
| 3 | |
| 3 | |
| 2 |


