Alteryx Designer Desktop Ideas
Share your Designer Desktop product ideas - we're listening!Submitting an Idea?
Be sure to review our Idea Submission Guidelines for more information!
Submission Guidelines- Community
- :
- Community
- :
- Participate
- :
- Ideas
- :
- Designer Desktop: New Ideas
Featured Ideas
Hello,
After used the new "Image Recognition Tool" a few days, I think you could improve it :
> by adding the dimensional constraints in front of each of the pre-trained models,
> by adding a true tool to divide the training data correctly (in order to have an equivalent number of images for each of the labels)
> at least, allow the tool to use black & white images (I wanted to test it on the MNIST, but the tool tells me that it necessarily needs RGB images) ?
Question : do you in the future allow the user to choose between CPU or GPU usage ?
In any case, thank you again for this new tool, it is certainly perfectible, but very simple to use, and I sincerely think that it will allow a greater number of people to understand the many use cases made possible thanks to image recognition.
Thank you again
Kévin VANCAPPEL (France ;-))
Thank you again.
Kévin VANCAPPEL
We are starting to use Alteryx as a full ETL DW build tool (and blogging about it too..)
Compared to other tools in the market there do not seem to be the usual SCD(slowly changing dimension) and other "standard" tools or templates to start building.
It would be great to have a template/Macros/guide to starting to build a DW solution. It is rather daunting starting with a blank page!
I really like the ability in 10.0 to turn on and off certain tool categories and specific tools within a category to keep your toolbar clean.
What would really take it to the next level is allowing users to manage them like bookmarks in a broswer - let me create new custom groups and add anything to them, or move tools among groups.
The favorites method lays the foundation for this, but is limited in that everthing is on one group. Using the method I suggest, users could basically have groups of tools tailored to specific analytic tasks.
When bringing data together it is often needed to assign a source to the data. Generally this happens when you union data and need to know things later about the data for context. It would save time to generate a source field that is assigned based upon the input connections of the union tool. Perhaps when unioning data you can assign a name to each input stream?
I'd like to see Alteryx allow a second install of your license on a second, personal machine. Tableau allows this and IMO is why there is such a robust online / blog community around that product.
For those of us that work at mid-size to large organizations, there are often strict rules governing internal data and use of cloud-based data sources. If I discover some new trick I'd like the share with my fellow Alteryx analysts outside of my company, I have no clear way to do that the same way I can with Tableau where I can do it at home not using my company's data.
Being able to learn new features and test things out on commonly available public data (ever notice that Superstore data set everyone who gets Tableau has?) would accelerate what we're able to do with the community site here and the larger analytics blogging community.
Currently the Throttle Tool allows control to a number of calls per minute. Some APIs include a limit to the calls per hour and a combination of throttles. I would love to see the option to choose the number of calls per hours and have 2 limit controls (eg 100calls per minute and 100calls per hour)
When a tool's input connector is already attached to a data stream that only accepts a single connection, attempting to attach a 2nd data stream with the same fields should automatically insert a Union tool. This would be similar to the way an Action tool is automatically added when you connect an Interface tool to another tool.
I was recently surprised to find that Alteryx doesn't already havea connector to upload to SFTP sites. I've managed to work around it with RunCommand and some external programs, but it's very cumbersome. A simple SFTP upload connector would be a great addition to Alteryx.
- moving or renaming a file after importing it
- deleting a file after importing it
- moving or copying a file after successfully exporting it
- writing a temporary file (i.e. batch file for RunCommand tool), then deleting it when finished
Same button should work with tool container 'disable' and/or collapse.
At TargetSmart, we create a lot of CSV deliverables for our customers. Since Alteryx differentiates between blank strings and null values (a good thing), the CSV output is not consistent between the two without an explicit multi-field formula step to set all null to empty strings (or vice versa). This is an easy fix for us. However, in some cases we have very large files with thousands of fields and millions of records. For these instances, the workflow run-time is greatly increased by the multi-field formula. If possible, I was wondering if adding a checkbox option to CSV output steps (“Make null/empty consistent” or “Never quote empty/null values”) would possibly be a more efficient approach as the check could be part of the output step (which I assume is native C++) versus the Multi-field formula (which I assume has some level of inefficiency in interpreting the formula dynamically).
I know you can add a field for "today" and then use that field to append the filename, so the output ends up as Ouput_Date.xlsx, but it would be great to be able to do that without adding a new field for the current date. If it were simply an option in the filt output settings dialog, that would be great.
The capability to input/output R Datasets via the input/output tools, together with all the other data formats as well (like csv, Excel, SAS, SPSS, etc).
I would like to see the same functionalitly that the Output Tool has in the Render tool. In the Output Tool, you can specify the Excel Worksheet along with the Sheet Name that you want to output too. Meaning Same Worksheet, different tab:
     C:Output FilesExample_Worksheet.xlsx|Report_1
     C:Output FilesExample_Worksheet.xlsx|Report_2
This functionality is not currently available in the Render Tool and would be very useful and cut out some manual operations on the back end that requires us to copy/paste from one file to another.
I tried using the Section Break technique that was offered as a suggestion, but it did not perform what I needed.
Hi
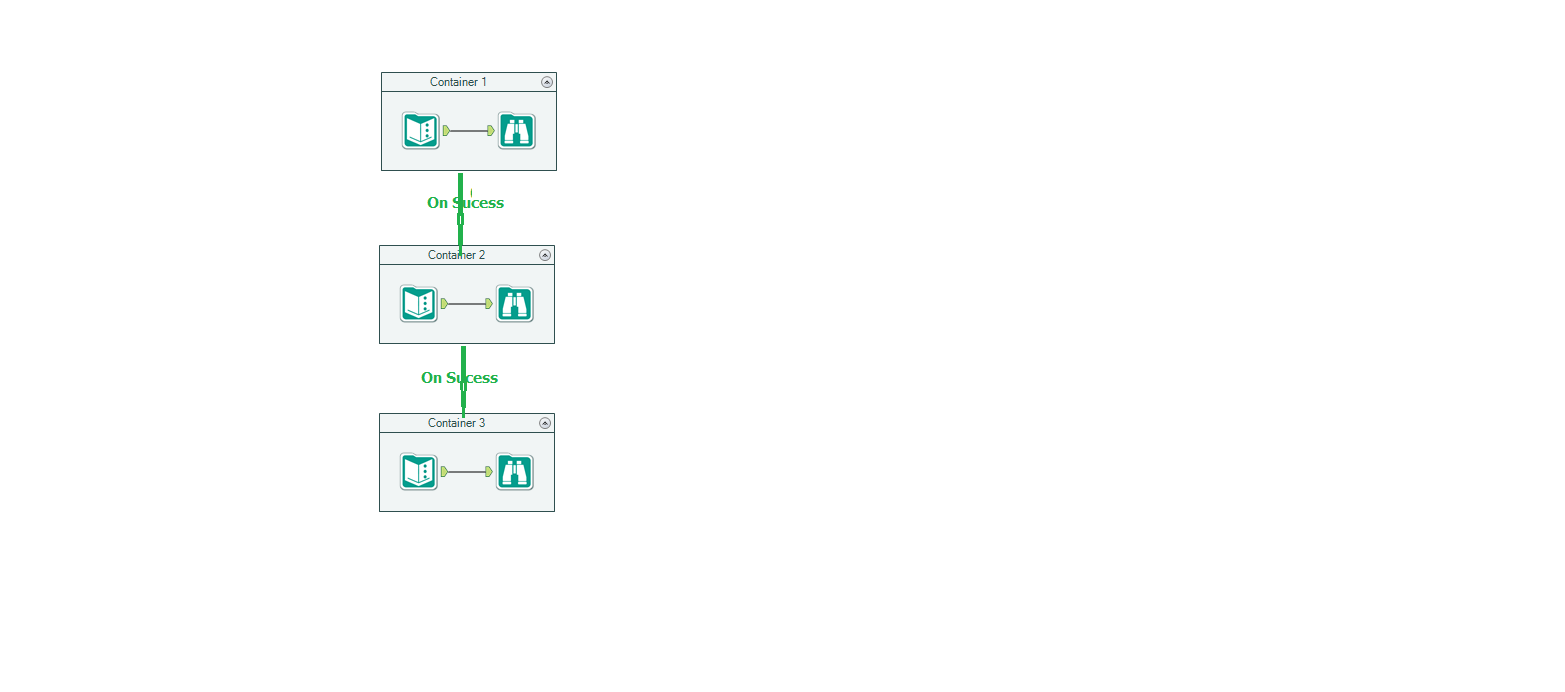
Wanted to control the order of execution of objects in Alteryx WF but right now we have ONLY block until done which is not right choice for so many cases
Can we have a container (say Sequence Container) and put piece of logic in each container and have control by connecting each container?
Hope this way we can control the execution order
It may be something looks like below
- New Idea 294
- Accepting Votes 1,790
- Comments Requested 22
- Under Review 167
- Accepted 55
- Ongoing 8
- Coming Soon 7
- Implemented 539
- Not Planned 111
- Revisit 59
- Partner Dependent 4
- Inactive 674
-
Admin Settings
20 -
AMP Engine
27 -
API
11 -
API SDK
221 -
Category Address
13 -
Category Apps
113 -
Category Behavior Analysis
5 -
Category Calgary
21 -
Category Connectors
247 -
Category Data Investigation
79 -
Category Demographic Analysis
2 -
Category Developer
210 -
Category Documentation
80 -
Category In Database
215 -
Category Input Output
646 -
Category Interface
240 -
Category Join
103 -
Category Machine Learning
3 -
Category Macros
153 -
Category Parse
76 -
Category Predictive
79 -
Category Preparation
395 -
Category Prescriptive
1 -
Category Reporting
199 -
Category Spatial
81 -
Category Text Mining
23 -
Category Time Series
22 -
Category Transform
89 -
Configuration
1 -
Content
1 -
Data Connectors
969 -
Data Products
3 -
Desktop Experience
1,552 -
Documentation
64 -
Engine
127 -
Enhancement
346 -
Feature Request
213 -
General
307 -
General Suggestion
6 -
Insights Dataset
2 -
Installation
24 -
Licenses and Activation
15 -
Licensing
13 -
Localization
8 -
Location Intelligence
80 -
Machine Learning
13 -
My Alteryx
1 -
New Request
204 -
New Tool
32 -
Permissions
1 -
Runtime
28 -
Scheduler
24 -
SDK
10 -
Setup & Configuration
58 -
Tool Improvement
210 -
User Experience Design
165 -
User Settings
81 -
UX
223 -
XML
7
- « Previous
- Next »
- Shifty on: Copy Tool Configuration
- simonaubert_bd on: A formula to get DCM connection name and type (and...
-
 NicoleJ
on:
Disable mouse wheel interactions for unexpanded dr...
NicoleJ
on:
Disable mouse wheel interactions for unexpanded dr...
- haraldharders on: Improve Text Input tool
- simonaubert_bd on: Unique key detector tool
- TUSHAR050392 on: Read an Open Excel file through Input/Dynamic Inpu...
- jackchoy on: Enhancing Data Cleaning
- NeoInfiniTech on: Extended Concatenate Functionality for Cross Tab T...
- AudreyMcPfe on: Overhaul Management of Server Connections
-
AlteryxIdeasTea
m on: Expression Editors: Quality of life update
| User | Likes Count |
|---|---|
| 4 | |
| 3 | |
| 3 | |
| 2 | |
| 2 |