Alteryx Designer Desktop Ideas
Share your Designer Desktop product ideas - we're listening!Submitting an Idea?
Be sure to review our Idea Submission Guidelines for more information!
Submission Guidelines- Community
- :
- Community
- :
- Participate
- :
- Ideas
- :
- Designer Desktop: Hot Ideas
Featured Ideas
Hello,
After used the new "Image Recognition Tool" a few days, I think you could improve it :
> by adding the dimensional constraints in front of each of the pre-trained models,
> by adding a true tool to divide the training data correctly (in order to have an equivalent number of images for each of the labels)
> at least, allow the tool to use black & white images (I wanted to test it on the MNIST, but the tool tells me that it necessarily needs RGB images) ?
Question : do you in the future allow the user to choose between CPU or GPU usage ?
In any case, thank you again for this new tool, it is certainly perfectible, but very simple to use, and I sincerely think that it will allow a greater number of people to understand the many use cases made possible thanks to image recognition.
Thank you again
Kévin VANCAPPEL (France ;-))
Thank you again.
Kévin VANCAPPEL
Here is the issue I have, when you are using a Join tool and you have multiple columns that you are joining on (to the point that they don't all show in the
Configuration window), i have a tendency to use the mouse scroll wheel to move down to see additional columns i am joining on. The mouse scroll controls different things depending on where your cursor is. If your cursor is over the Left or Right columns then the scroll button will change the Fields you are using to join on. I have messed up more workflows then i care to mention due to this. I do not think it is appropriate for the scroll wheel to effect and change the fields in the configuration window and it should only be used to scroll up and down in the configuration window.
Added in Alteryx Version 2020.3, the Browse tool no longer shows a profile of the complete dataset (it is capped when the record data size reached 300MB).
My proposed solution is an optional override of the record size limit on the browse tool (which will make the profiling take longer, but actually profile the entire dataset). I would also like a general user setting to set the default behavior of the browse tool to either be limited or unlimited.
Below is the newly included documentation of the Data Profiling Limit, which I'm proposing can be overridden.
Data Profiling Limit
Data Profiling in the Browse tool is capped at 300 MB. This allows you to process very large datasets faster. For each record in the incoming dataset, we process the record and add the record size to a counter. Once the counter reaches 300 MB, we stop processing records.

It is important to note that there is no specific number of records that we can process. This depends on the dataset since a record size can range from 1 byte to a few thousand bytes. This record size is different from the file size, displayed in the Results grid and Data Profiling Holistic View. The file size is generally different since it has been compressed to optimize spacing.

In other words, 300 MB of record size is not the same as 300 MB of file size.
This new tool can cause confusion when looking at the data profile (e.g. if you expect the sum to be $3 million, but the browse tool is only showing 2% of your total records in the profile tool, the profile sum may only show $60 thousand).
The sampled version with a cutoff of 300MB is rarely useful if you are using browse tools to get a quick sense of the variable profiles on medium sized datasets (around 1 million records) since this rarely will fit into the 300MB record size limit.
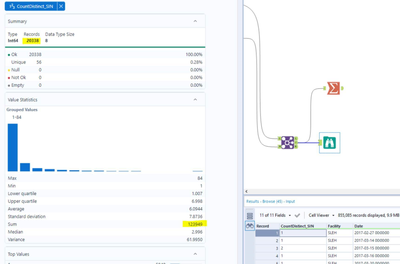
An example can be shown in the image below, where the dataset contains 855,085 records, but the browse tool is profiling only the first 20,338.
Again, being able to override this 300MB record size limit would fix the problem created in the 2020.3 change to the browse tool.
The Problem: Sometimes we are developing workflows where we use a data connection that the developer has access to but not necessarily the people running the workflow do.
For example,
- A workflow is pulling from one database to another, with some specific transformations.
- This workflow is used by many people, some have Designer for other purposes.
- The workflow also writes to a log table, documenting different parts of the workflow for auditing purposes.
- This log table is not something that the people running the workflow should have access to write to other than when running this workflow
- This log table outputs using a data connection so that it is not embedding passwords (a company-wide best practice)
- For someone to run this workflow with this set up, they would need access to this log table's data connection
- If the log table data connection is shared to that group of users, now any of the users with Designer can go write whatever they would like to that table since that data connection has access to.
- This also makes the log table unsecure for auditing purposes.
The Solution: We are looking for a way to have a data connection in a workflow without giving all of the running users full access to use that connection in their workflows. Almost a proposal of two tiers of permissions:
- Access to use a data connection in a workflow you are running
- Access to use a data connection in a workflow you are building
When using the text mining tools, I have found that the behaviour of using a template only applies to documents with the same page number.
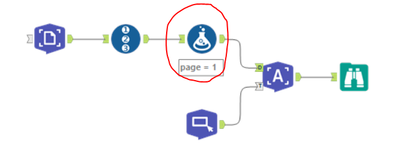
So in my use case I've got a PDF file with 100+ claim statements which are all laid out the same (one page per statement). When setting up the template I used one page to set the annotations, and then input this into the T anchor of the Image to Text tool. Into the D anchor of this tool is my PDF document with 100+ pages. However when examining the output I only get results for page 1.
On examining the JSON for the template I can see that there is reference to the template page number:
And playing around with a generate rows tool and formula to replace the page number with pages 1 - 100 in the JSON doesn't work. I then discovered that if I change the page number on the image input side then I get the desired results.
However an improvement to the tool, as I suspect this is a common use case for the image to text tool, is to add an option in the configuration of the image to text tool to apply the same template to all pages.
Would be great if anytime a tool (macro tools in particular such as "Data Cleansing" tool) is copied all items from the copied tool are retained to the new pasted version of the tool. Would expect in the instance of the Data Cleansing tool for example that in lieu of not showing the fields that were in the copied from tool to be shown similar tool in which they show but noted as "Missing" and then as the new copied tool is attached to a like data source (likely same data source elsewhere) they then are checked or not checked and no longer showing as "Missing".
This would allow these tools to be copy/pasted and repurposed vs wiping out as they won't be associated right away on the pasting process until manually moved into the proper place on the respective new or updated workflow.
Could Alteryx create a solution or work around for their tools to retry the queries with Azure DB connectivity outages.
If there are intermittent, transient (short-lived) connection outages with cloud Azure DB, then what action can we take with Alteryx to retry the queries.
Examples of retry Azure SQL logic:
“2. Applications that connect to a cloud service such as Azure SQL Database should expect periodic reconfiguration events and implement retry logic to handle these errors instead of surfacing these as application errors to users”.
SQL retry logic is a feature that is not currently supported by Alteryx.
For further information please see [ ref:_00DE0JJZ4._5004412Star:ref ]:
Hi Alteryx Support,
We are experiencing intermittent errors with our Alteryx workflows connecting to our Azure production database with Alteryx Designer v2018.4.3.54046.
Is there anything we can do to avoid or work around these intermittent / transient (short-lived) connection errors, such as, changing the execution timing or the SQL driver settings.
Or can we incorporate examples of retry Azure SQL logic:
“2. Applications that connect to a cloud service such as Azure SQL Database should expect periodic reconfiguration events and implement retry logic to handle these errors instead of surfacing these as application errors to users”.
https://docs.microsoft.com/en-us/azure/sql-database/sql-database-develop-error-messages
https://docs.microsoft.com/en-us/azure/sql-database/sql-database-connectivity-issues
Salesforce Import process, which contains 25 Workflow modules, completed with errors on:
Mon 25/02/2019 23:27
Error 1
2019-02-25 23:11:23:
2.1.18_SF_MailJobDocument_Import.yxmd:
Tool #245: Error opening connect string: Microsoft OLE DB Provider for SQL Server: Login timeout expired\HYT00 = 0; Microsoft OLE DB Provider for SQL Server: Invalid connection string attribute\01S00 = 0.
Error 2:
2019-02-25 23:26:31:
2.1.25_SF_ClientActivityParticipant_Import.yxmd:
Tool #258: Error opening connect string: Microsoft OLE DB Provider for SQL Server: Login timeout expired\HYT00 = 0; Microsoft OLE DB Provider for SQL Server: Invalid connection string attribute\01S00 = 0.
Salesforce Import Workflow completed with errors on:
Wed 27/02/2019 23:24
Error 3
2019-02-27 23:06:47:
2.1.17_SF_MailJobs_Import.yxmd:
DataWrap2ODBC::SendBatch: [Microsoft][SQL Server Native Client 11.0]TCP Provider: The specified network name is no longer available.
Regards,
Nigel
Hello,
As of today, only English is available. But it's hard to convince French Customers with french language data to buy the AIS if it cannot work with their data.
Best regards,
Simon
I am running into unexpected functionality when utilizing the date interface tool in an Analytic App after upgrading to 21.3. Previously I was able to easily select dates in the past in the app interface by first selecting the Year, then the month, date, etc. After updating I am only able to see the prior and upcoming three months, which makes it difficult if you need to navigate back, say, 10 years. A ticket was put in they could not find when or why this change was made. This issue was brought up to our Designer SME group and they agreed that this isn't an improvement on the old design and is more cumbersome. They recommended posting to the Ideas page to bring back the old design.
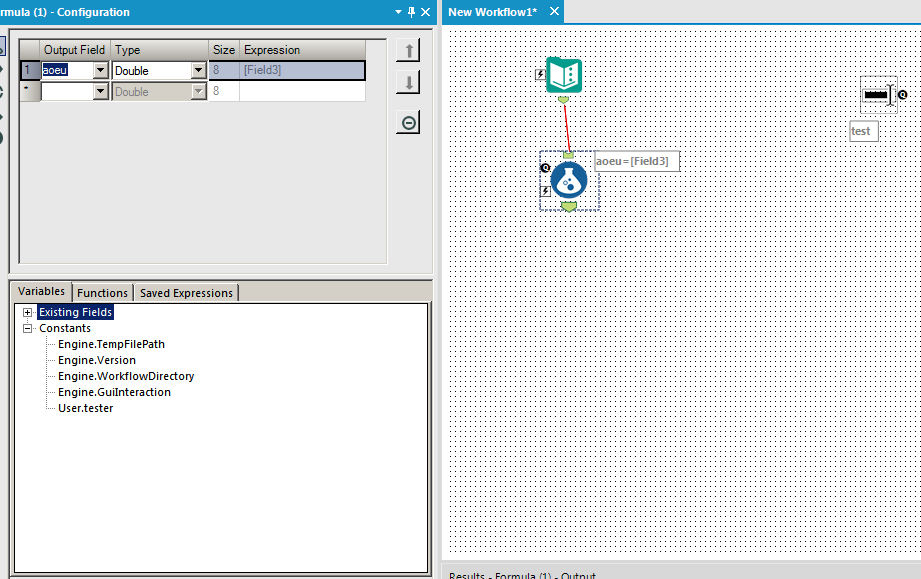
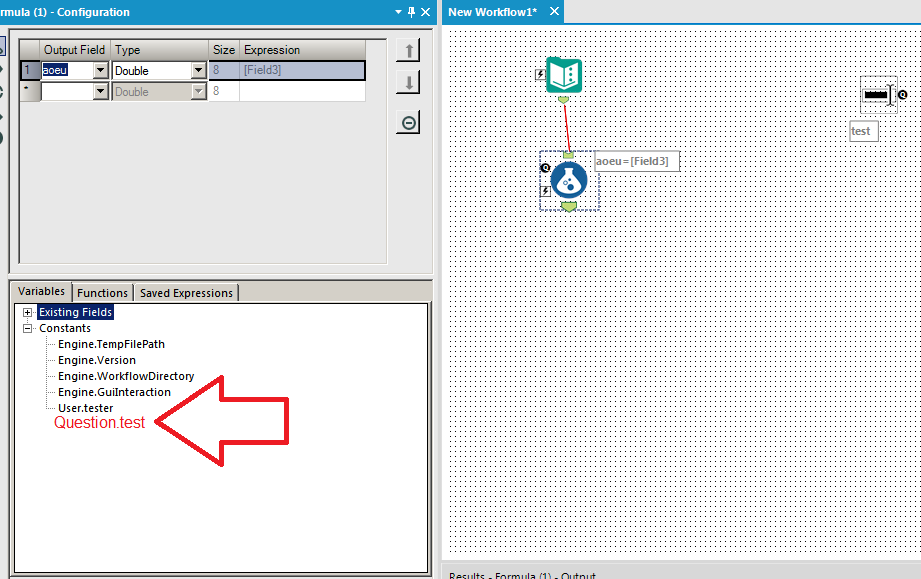
Whenever I add an interface tool, it adds a constant just like the 4 engine constants and any user constants. It would be useful if tools like the formula and filter automatically added question constants to the list for you to use. This would be identical to how user constants behave currently. Here is the before and after for visual effect:
BEFORE:
AFTER:
Create new connector to pull Salesforce Reports
We are a large company with tens of thousands employees using Salesforce on a daily basis. Over the years, we have worked with Salesforce to make many customizations and create many reports to provide data for various reporting needs. However, we have increasingly found it inefficient and prone to error to download the reports manually. We have many teams using the Salesforce reports as a base to create additional business insights.
Alteryx is a great tool to manage data ETL and workflows, but it does not support pulling data from Salesforce reports directly. Instead, it only offers connectors to pull data from base Salesforce objects. The data from Salesforce objects such as tables can be useful, but do not necessarily offer the logical view of Salesforce reports, and may require a lot of efforts to reconcile the data consistency against the reports our users are used to. Sometimes, it may be impossible to repeat producing the same data from Salesforce tables as those from Salesforce reports. That in turn would cause a lot of efforts spent by the reporting teams, their audience, and users of the Salesforce reports to match things up.
Salesforce does not have any out-of-box solution to schedule downloading the reports. At our request, their support team did some research and have not found a good 3rd-party solution in the Salesforce App Exchange ecosystem that supports this need.
I strongly believe this is a great opportunity for Alteryx. Salesforce already has an API that allows for building custom applications to pull Salesforce reports. However, most Salesforce users are more business oriented and do not necessarily have the appetite to engage with their IT staff or external resources provide to develop such apps and bear the burden to main them.
I have attached the Salesforce Reports and Dashboards API Developer Guide for your reference.
Sincerely,
Vincent Wang
Now : when you double click on the part of a field name text field (Formula, Filter, etc.) it selects only the word you double clicked.
Idea : It would be easier if a double click would select the entire field name with brackets for copy-pasting as an example.
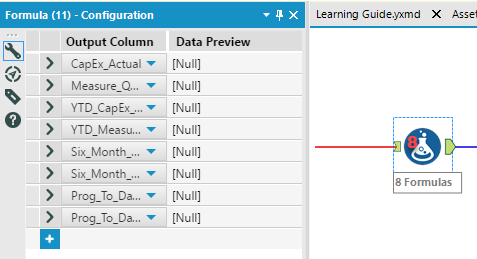
Hopefully this is the right place to post this and it hasn't been suggested already but I think it would be useful to add a numeric indicator to the formula tool to show how many formulas are being done with one tool. It would be useful when going back into or sharing workflows that a user would know more than one function is being carried out at that point. Currently I change the annotation to show how many but I think it would be useful if the icon changed dynamically. Below is a mockup of what I think it should look like.
Thanks,
Pete
I would love to see a "Product" option added to the summarize tool. I can currently count, sum, mean etc., but I can't multiply my data while grouping. There are numerous "work arounds", but a native product function built into the summarize tool would be great.
Thanks for listening!
Hello all,
Some Database, including Hive, support natively scheduled queries (yes, the scheduling configuration is inside the database, not through etl/dataprep system). I think this would be an interesting feature for in-db workflow output : you play the worflow once and then only have to run it when it changes, the database do the scheduling.
https://cwiki.apache.org/confluence/display/Hive/Scheduled+Queries
Intro
Executing statements periodically can be usefull in
- Pulling informations from external systems
- Periodically updating column statistics
- Rebuilding materialized views
Best regards,
Simon
When we industrialize our workflows, we often use a parameter file with a command like :
AlteryxEngineCmd.exe MyAnalyticApp.yxwz AppValues.xml
I would like to have the parameter file path with its extension as an engine constant, like we have the workflow name.
As a best practice, I'd like to automagically change any drive mapping to UNC when saving my workflows. This applies to both local and gallery saves.
Cheers,
Mark
Alteryx doesnt support querying tables within Apache Ignite via Ignite ODBC connector. Connectivity from Ignite being an in memory database with Alteryx would help in better connectivity via ODBC.
Please provide the ability to toggle on a dark mode for the Designer. The new version of Alteryx has changed the UI from a blue to a white. Its straining on the eyes with the lack of any contrast in the toolbar. I know about the ability to change the canvas colors, but it would be nice to toggle the entire UI from a white to a grey.
Containers are a great feature. They allow us to create larger workflows in smaller canvases, and manage the flow and appearance of our work. However the design whether intentional or flawed that allows the container window to interact with the layers behind it is annoying. Connection wires should not redirect within a container because of things on the canvas behind the container. Likewise if I have a container open, I should not be able to grab a tool or container behind the open container through the container canvas. Please fix this flaw.
- New Idea 294
- Accepting Votes 1,790
- Comments Requested 22
- Under Review 168
- Accepted 54
- Ongoing 8
- Coming Soon 7
- Implemented 539
- Not Planned 111
- Revisit 59
- Partner Dependent 4
- Inactive 674
-
Admin Settings
20 -
AMP Engine
27 -
API
11 -
API SDK
221 -
Category Address
13 -
Category Apps
113 -
Category Behavior Analysis
5 -
Category Calgary
21 -
Category Connectors
247 -
Category Data Investigation
79 -
Category Demographic Analysis
2 -
Category Developer
210 -
Category Documentation
80 -
Category In Database
215 -
Category Input Output
646 -
Category Interface
240 -
Category Join
103 -
Category Machine Learning
3 -
Category Macros
153 -
Category Parse
76 -
Category Predictive
79 -
Category Preparation
395 -
Category Prescriptive
1 -
Category Reporting
199 -
Category Spatial
81 -
Category Text Mining
23 -
Category Time Series
22 -
Category Transform
89 -
Configuration
1 -
Content
1 -
Data Connectors
969 -
Data Products
3 -
Desktop Experience
1,552 -
Documentation
64 -
Engine
127 -
Enhancement
346 -
Feature Request
213 -
General
307 -
General Suggestion
6 -
Insights Dataset
2 -
Installation
24 -
Licenses and Activation
15 -
Licensing
13 -
Localization
8 -
Location Intelligence
80 -
Machine Learning
13 -
My Alteryx
1 -
New Request
204 -
New Tool
32 -
Permissions
1 -
Runtime
28 -
Scheduler
24 -
SDK
10 -
Setup & Configuration
58 -
Tool Improvement
210 -
User Experience Design
165 -
User Settings
81 -
UX
223 -
XML
7
- « Previous
- Next »
- Shifty on: Copy Tool Configuration
- simonaubert_bd on: A formula to get DCM connection name and type (and...
-
NicoleJ on: Disable mouse wheel interactions for unexpanded dr...
- haraldharders on: Improve Text Input tool
- simonaubert_bd on: Unique key detector tool
- TUSHAR050392 on: Read an Open Excel file through Input/Dynamic Inpu...
- jackchoy on: Enhancing Data Cleaning
- NeoInfiniTech on: Extended Concatenate Functionality for Cross Tab T...
- AudreyMcPfe on: Overhaul Management of Server Connections
-
AlteryxIdeasTea
m on: Expression Editors: Quality of life update
| User | Likes Count |
|---|---|
| 7 | |
| 4 | |
| 4 | |
| 3 | |
| 3 |

