Alteryx Designer Desktop Ideas
Share your Designer Desktop product ideas - we're listening!Submitting an Idea?
Be sure to review our Idea Submission Guidelines for more information!
Submission Guidelines- Community
- :
- Community
- :
- Participate
- :
- Ideas
- :
- Designer Desktop : Idées en tête de liste
Featured Ideas
Hello,
After used the new "Image Recognition Tool" a few days, I think you could improve it :
> by adding the dimensional constraints in front of each of the pre-trained models,
> by adding a true tool to divide the training data correctly (in order to have an equivalent number of images for each of the labels)
> at least, allow the tool to use black & white images (I wanted to test it on the MNIST, but the tool tells me that it necessarily needs RGB images) ?
Question : do you in the future allow the user to choose between CPU or GPU usage ?
In any case, thank you again for this new tool, it is certainly perfectible, but very simple to use, and I sincerely think that it will allow a greater number of people to understand the many use cases made possible thanks to image recognition.
Thank you again
Kévin VANCAPPEL (France ;-))
Thank you again.
Kévin VANCAPPEL
In complex Alteryx workflows, it can be hard to navigate between different tool containers - especially when there are dozens spread across in a large canvas.
I would love a feature where users could create a 'table of contents' using clickable text or bookmarks at the top of the workflow. For example, Clicking on a text label named 'Output Calculation' would automatically scroll to view to the Tool Container named 'Output Calculation'.
Suggested Implementation ideas :
- Text boxes or Comment Tools support clickable links that scroll the canvas to a specific container or tool.
- Add a new 'Bookmark' or 'Jump To' action tied to container names or Tool IDs.
- Right click on a text label or container and choose 'Link to' or 'Scroll to this container'.
- Use CTRL + Click or ALT + Click behavior on a text comment to jump.
This would massively improve usability and workflow navigation, especially for large teams or workflows that are shared across departments.
Inspiration :
Tools like POWER BI and TABLEAU allow similar dashboard or bookmark style navigation . Implementing this in Alteryx designer would be a game changer.
-
Category Interface
-
Desktop Experience
-
Enhancement
-
New Request
Currently the simulation sampling tool doesn't accept model objects from time series tools as a model input. It would be beneficial if it could so one could run simulations from Time series output (or a new tool is built to offer this functionality)
-
Category Prescriptive
-
Category Time Series
-
Desktop Experience
-
Enhancement
The global constants, specifically the user-defined ones (within the Workflow configuration) are a great tool for making quick changes. I would love to be able to include the value of these constants directly within a comment: the Comment tool, the captions for Tool & Control Containers, or the Annotation of individual tools. My immediate use-case would be to clearly show what the constants are set to, directly on the canvas, though there are certainly a lot of other uses as well.
-
Category Documentation
-
Desktop Experience
-
Enhancement
It would be great for the Run Until Selected Tool to be able to used on Browse tools. In complex workflows, it is useful for testing certain parts and investigating all records in the Browse component instead of the subset previewed in the previous tool leading up to the Browse tool.
-
Desktop Experience
-
Enhancement
I would like a function to be added that pulls the weekending date of an entered date.
For example, the week ending date for today, 2025-06-10 would be 2025-06-14.
It could be called DateTimeWeekEnd and look like DateTimeWeekEnd("2025-06-10","Saturday")
The value entered first would be a date or field with an optional parameter to choose Saturday or Sunday for the week ending date. I would think Saturday would be the default week ending date but I am not sure.
-
Category Time Series
-
Desktop Experience
-
New Request
I've seen a few older threads on this but wanted to bring it up again.
I have numerous workflows in which I have built in "fail safes" to prevent passing bad data out to downstream databases/reports. I have Message tools that provide a specific message on whether the fail safe was triggered or the new/refreshed data was passed through. The problem with the Message tool is that it is very easy for the message to get lost in the myriad log results so you don't automatically see it. The same is true for using the Browse tool to view a dynamic and more easy-to-read message/result, you still have to make the overt decision to click the Browse tool to review the result/message.
Admittingly, on their own, these "issues" seem minor. However, when running multiple workflows as part of a group or on a regular basis, some of which can be very large and complex, its easy for these "minor issues" to become major inconveniences to utilize as they are intended or they just get lost in the static of everything that happens when a workflow runs.
Having something similar to a Report Text tool that can render an image and formula-driven text/conditions (font and background color controls) directly and conspicuously on the canvas would be AWESOME and go a long way to providing immediate/easy-to-see information regarding the results of the workflow.
I ask/encourage the Alteryx team to explore providing this capability.
-
Desktop Experience
-
New Request

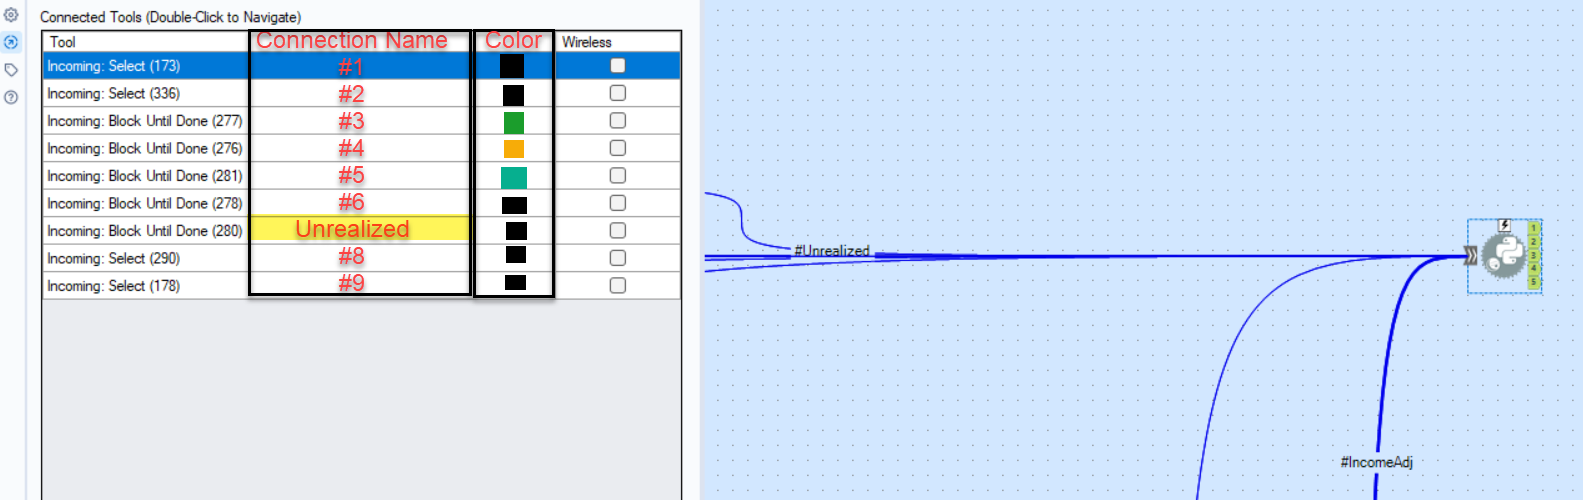
I only have 2023.2, hoping to get 24.2 soon, so I haven't been able to try the newest color feature, but my idea is additional columns in the Navigation panel of a tool to update multiple connection features in one place (names and color at the moment). I'm using Python, and I have a variety of data inputs I would like to be able to easily reference in my code. Currently default names are #1, #2, based on order of connection. Similarly, I know for tools that accept multiple inputs, like Union and Join Multiple, this could also be useful if needing to reorder based on the connection names. I'm also not sure how this ties in to the color feature as described in Connection Configuration, but this could also be a good place to change colors of multiple connections at once instead of clicking into each connection. This would also require this list to allow for multiple selection at the same time, as right now you can't hold shift and select multiple lines.
-
Desktop Experience
-
Enhancement
-
UX
Currently, the Marketplace Add-ons interface when opened within Designer only contains the more significant, Alteryx made tools:

Which is a very useful feature, however if the tool I want to download is not on this limited list (or, I want a particular version), I still need to go through the Marketplace to download this.
It would be great if this functionality had all tools on the Marketplace included - potentially with the option to filter to Alteryx made tools only.
Cheers!
-
Desktop Experience
-
Enhancement
-
Installation
Given that the current Iterative type Macro will hold each iteration output in memory, to merge it all at the end of the iterations, wouldn't it make sense to have a checkbox for "Large Data Sets" where each iteration's output is stored to a tmp file, to be merged after the iterations stop?
As it is, holding multiple iterations in memory may often be too much data for a PC, no matter how hefty. By off-loading the memory objects to a tmp file and only holding the currently working iteration in memory, speed and efficiency would be gained.
This is especially critical when using Iterative Macros to cycle through APIs (pagination) and while each individual data pull may be small enough, they quickly grow in memory as each data pull is added to the in-memory object.
-
Category Macros
-
Desktop Experience
-
Enhancement
In CrossTab tool, it have Total Row and Total Column as option.
For Total Row, it work all the sum, count, and avg etc.
but for "Total Column", it only sum (even i not select the sum)
To solved this I suggest to add Total Column for Count, Avg and etc.
version 2024.2


-
Category Transform
-
Desktop Experience
-
Enhancement
Is there a way to update workflow constants in analytic apps using an interface tool?
-
Category Interface
-
Desktop Experience
-
Enhancement
As many Alteryx Designer users are already aware, there is an option to connect a tool to multiple tools at once by right clicking on it and selecting View Possible Connections.
I would like to suggest an enhancement for this feature, which I think will make it even easier to connect multiple tools.
Scenario 1
Suppose you drag & dropped many Append tools to existing connections as you realized you needed to add an extra information to your data. For example, a year input from a Text Input tool that is modified by the interface tool. If there were 30 Append tools, you would have to select all those available "ID - Append Fields S" checkboxes one by one.
Scenario 2
You added multiple Input Data tools to canvas but don't want to select them individually to connect them to a single Union tool.
Idea
If there were a group checkbox for each tool category on each side (Output Connections and Input Connections), creating multiple connections would be as easy as clicking on the group checkbox on the Append Fields category on the Input Connections side (for Scenario 1) or clicking on the group checkbox for Input Data category on the Output Connections side (for Scenario 2).
-
Desktop Experience
-
Enhancement
-
UX
Allow the user to select which type of Join is happening in the join tool. Allow the J anchor to output the join type within a radio option in the tool configuration. Right now the J anchor outputs matches in both inputs. New suggestion would allow the user to select a Right Outer or Left Outer join without having to use a Union tool after the Join.
-
Category Join
-
Desktop Experience
-
Enhancement
It would be nice to track changes. The function would need to have an on and off switch. Some workflows are large and you want to go back to the changes you've made. My team has 2 identical workflows one for production and one for validation. Tracked changes would help manage changes between both workflows. The tracked changes could be something like highlighting the tools red once changed, and after the function is turned on. I have attached a sample image for your reference. Thank you.
-
Category Documentation
-
Desktop Experience
-
New Request
1. Image Processing Tool functionality should be available in Reporting tools.
2. Image Output Location should allow for a temp file location
3. Image Processing should allow lock of aspect ratio when Cropping (like Scale)
4. Image Processing should allow for fieldname selection for Crop, Scale ...etc to allow for custom calculations. Being able to generate custom values for width and height based upon the values generated in from image profile would be useful
-
Category Reporting
-
Desktop Experience
-
Enhancement
-
New Request
The Multi-Field Binning tool, when set to equal records, will assign any NULL fields to an 'additional' bin
e.g. if there are 10 tiles set then a bin will be created called 11 for the NULL field
However, when this is done it doesn't remove the NULLs from the equal distribution of bins across the remaining items (from 1-10).Assuming the NULLs should be ignored (if rest are numeric) then the binning of remaining items is wrong.
Suggestion is to add a tickbox in the tool to say whether or not NULL fields should be binned (current setup) or ignored (removed/ignored completely before binning allocations are made).
-
Category Preparation
-
Desktop Experience
Anytime you create a formula in the formula tool, you get a data preview based on the values in the first row of data. However, if you have a complex "IF c THEN t ELSEIF c2 THEN t2 ELSE f ENDIF" formula then the data combination that gives a TRUE result will likely exist on another row. Therefore, you need to run the workflow, or place a filter tool upstream to isolate the specific row, to test if the formula result is correct.
It would be easier if you could select the Input anchor of the Formula tool, then filter the data in the results window to isolate the row in questions, then the data preview would be based on that filtered data set. I believe this would save a lot of time in the workflow development phase.
-
Category Preparation
-
Desktop Experience
-
Enhancement
I want to have the ability to share workflows with non-Alteryx users so they can see what steps were followed within my workflows in order to create the output(s). Without a read-only viewer Alteryx users are forced to screenshot and write out the steps they followed in the workflows to document what they did which can be extremely laborious and time consuming when workflows get into the 50+ tool range. A read-only viewer would save Alteryx users time and give non-Alteryx users a sneak peak into how Alteryx works as well. It could peak the interest of non-Alteryx users to learn more about Alteryx and possibly convince them to download a trial and eventually purchase a license, so it could improve documentation methods as well as be an asset for marketing to non-Alteryx users. For reference, Tableau offers a similar solution called Reader.
-
Desktop Experience
-
Licensing
-
New Request
when using switch formula as a more elegant way then if else
't' is not working in switch while it working in if then.
so i recommend to have a formula call True() and False() as excel to solve this issue.


-
Category Preparation
-
Desktop Experience
-
Enhancement
Currently the summarize tool field selector has one empty column on the left side that must be clicked on when selecting the fields, otherwise the 'Add' button does not activate.
I don't understand why the need for this empty column to be used when selecting the fields to aggregate/calculate. Why can't we select the fields by clicking directly on the names of the fields instead? Selecting fields this way is actually possible, but then the 'Add' button does not allow for the selection of the 'Group by' or aggregation method.
This creates confusion, especially for beginner users who might click on the field names, see them selected and be puzzled why the 'Add' button is not working.
Thanks!
-
Category Transform
-
Desktop Experience
-
Enhancement
- New Idea 377
- Accepting Votes 1 784
- Comments Requested 21
- Under Review 178
- Accepted 47
- Ongoing 7
- Coming Soon 13
- Implemented 550
- Not Planned 107
- Revisit 56
- Partner Dependent 3
- Inactive 674
-
Admin Settings
22 -
AMP Engine
27 -
API
11 -
API SDK
228 -
Category Address
13 -
Category Apps
114 -
Category Behavior Analysis
5 -
Category Calgary
21 -
Category Connectors
252 -
Category Data Investigation
79 -
Category Demographic Analysis
3 -
Category Developer
217 -
Category Documentation
82 -
Category In Database
215 -
Category Input Output
655 -
Category Interface
246 -
Category Join
108 -
Category Machine Learning
3 -
Category Macros
155 -
Category Parse
78 -
Category Predictive
79 -
Category Preparation
402 -
Category Prescriptive
2 -
Category Reporting
204 -
Category Spatial
83 -
Category Text Mining
23 -
Category Time Series
24 -
Category Transform
92 -
Configuration
1 -
Content
2 -
Data Connectors
982 -
Data Products
4 -
Desktop Experience
1 605 -
Documentation
64 -
Engine
134 -
Enhancement
407 -
Event
1 -
Feature Request
218 -
General
307 -
General Suggestion
8 -
Insights Dataset
2 -
Installation
26 -
Licenses and Activation
15 -
Licensing
15 -
Localization
8 -
Location Intelligence
82 -
Machine Learning
13 -
My Alteryx
1 -
New Request
226 -
New Tool
32 -
Permissions
1 -
Runtime
28 -
Scheduler
26 -
SDK
10 -
Setup & Configuration
58 -
Tool Improvement
210 -
User Experience Design
165 -
User Settings
86 -
UX
227 -
XML
7
- « Précédent
- Suivant »
- abacon sur : DateTimeNow and Data Cleansing tools to be conside...
-
 TonyaS
sur :
Alteryx Needs to Test Shared Server Inputs/Timeout...
TonyaS
sur :
Alteryx Needs to Test Shared Server Inputs/Timeout...
-
 TheOC
sur :
Date time now input (date/date time output field t...
TheOC
sur :
Date time now input (date/date time output field t...
- EKasminsky sur : Limit Number of Columns for Excel Inputs
- Linas sur : Search feature on join tool
-
MikeA
sur :
Smarter & Less Intrusive Update Notifications — Re...
- GMG0241 sur : Select Tool - Bulk change type to forced
-
Carlithian
sur :
Allow a default location when using the File and F...
- jmgross72 sur : Interface Tool to Update Workflow Constants
-
pilsworth-bulie
n-com sur : Select/Unselect all for Manage workflow assets
| Utilisateur | Compte |
|---|---|
| 31 | |
| 7 | |
| 3 | |
| 3 | |
| 3 |