Data Science
Machine learning & data science for beginners and experts alike.- Community
- :
- Community
- :
- Learn
- :
- Blogs
- :
- Data Science
- :
- Automated Billing Reconciliation Using the Image t...
- Subscribe to RSS Feed
- Mark as New
- Mark as Read
- Bookmark
- Subscribe
- Printer Friendly Page
- Notify Moderator
Normally, billing is a fairly straightforward process: your company sends out a monthly invoice, and your client sends back a check payable to your company. However, often enough, when a client issues their payment, the dollar amount is based on an estimate generated in advance of receipt of the invoice. This is done for many reasons: ensuring payments are sent on time, simplifying cost forecasting, and gaining efficiencies through automation, etc. With each estimated invoice, there comes a true-up – a reconciliation between what was expected and the actual payment.
Billing reconciliation. It is hard to think of two words that inspire as much immediate apprehension as those. This process sits at the center of an unpleasant Venn diagram between complicated, time-consuming, necessary, and urgent. Anyone who has spent any time supporting their billing team has more than a few stories of last-minute, frantic crunches trying to finalize the reconciliation before their billing period ends, and they need to start work on the next cycle.
Source: GIPHY
The story is a familiar one. The billing period just ended, and you are now in the process of receiving payments from all of your client accounts. Many of these go off without a hitch. However, you have a few dozen legacy accounts and a handful of higher priority accounts that insist on special treatment that are reliably the source of discrepancies between what you billed and what was paid. Compounding this, all of these accounts use different formats for the billing files they send you. If you are lucky, they send you a .csv you can aggregate/de-aggregate and match to your own internal data, but you are not lucky. They send you PDFs.
Except that you ARE lucky. You have Alteryx Intelligence suite (you have AIS, right? If you don’t, download it here) and have a way to completely automate the ingestion of PDF billing reports, matching them to your internal data, identifying discrepancies, and generating your in-month recon report in minutes…oh and it can also automatically generate your historic recons for when that incredibly inconvenient audit strikes in the middle of your busy season.
Source: GIPHY
The Workflow
First, before getting started on the workflow, it is worth taking a pause to clearly define the scope of the problem. In this example, there are three clients with three months of internally generated invoices for services my_company renders. These invoices are PDFs, and the my_company’s internal data lives in a .xlsx file (which could just as easily be stored in a SQL database or anywhere else – Alteryx makes connecting to different data sources super easy). The main steps are:
- Find a way of reading these PDFs in
- Identify the areas of the PDFs that have relevant data
- Parse the data from the PDFs
- Connect to the local data
- Standardize across the different formats
- Compare these files to internal data and pick out the discrepancies
- Finally, generate a summary report that the billing team can use to issue/request credits.
Easy.
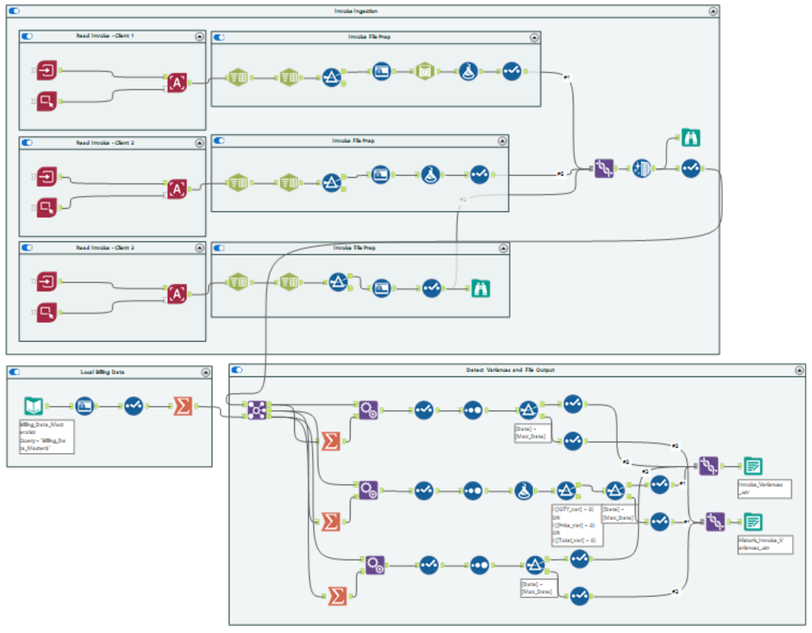
Here is how we are going to do it:
Please download the workflow at the Alteryx Community Gallery here (but scroll to the bottom for some notes on how to use it).
Image to Text – The Key to Automating Billing Reconciliation
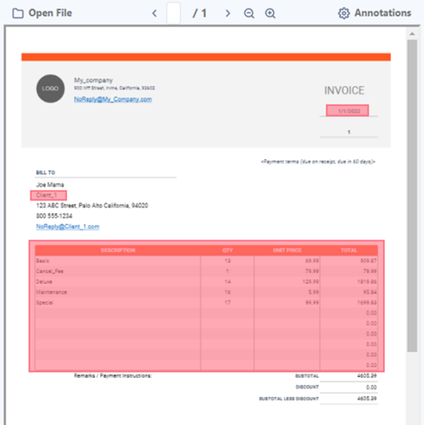
Let’s start with that first piece – read in the PDFs, ID the relevant data, and parse that data. Here the Image to Text tool is going to do the real heavy lifting. This tool will take as inputs the Image Input tool and the Image Template tool. The imagine input tool is going to tell the Image to Text tool the location of the PDF invoices in our directory. The Image Template tool highlights the areas in the PDF that contain data of interest to the reconciliation. By combining these three tools, this workflow will automatically read all PDFs in the specified directory of the same format and extract all of the relevant data that we need to complete our billing recon.
To identify these areas that contain the data of interest, first a sample file from the directory is chosen. Then, each of the areas that contain relevant data is manually highlighted and annotated; Client, invoice_date, invoice_data in this example. The Image to Text tool will then use this as the template for any and all invoices in the directory referenced by the Image Input tool. The neat thing about this is that this operation only ever needs to be done once for each format you need to include. In this example, each client has their own format, so this operation is repeated three times, as can be seen in the image of the workflow above. When creating these annotations, it is critical to correctly specify the datatype. In this example, the invoice contains tabular data, which the image template tool can correctly interpret if correctly specified!
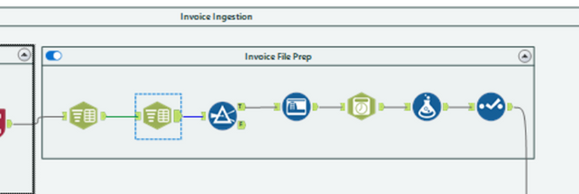
Next, on to the parsing. Here, the Text to Columns tool is our friend. The output of the image to a text file will contain that tabular data in a pipe-delimited format with embedded new lines. The first step is to split out these embedded new lines into rows using the Text to Columns tool and select the split to rows option. Following this, use the Text to Columns tool again. This time, splitting to columns using the pipe delimiter and being careful to specify the correct number of columns. This last bit is tricky as the Image to Text tool can sometimes detect extra columns depending on how the initial table was formatted (e.g., if the initial table was constructed using merged cells – this can trigger the tool to detect an additional column).
Standardizing the data is going to vary from PDF format to PDF format, but you should only have to create these pipelines once for each format. In this example, the first one required filtering out some extraneous records, standardizing some data and dates, and then coercing the right data types. Some combination of these steps was also required for the other formats as well before finally using the Union tool to connect each of these data streams into one table.
Take a moment to appreciate that if you have made it to this point, the hard part is over. Celebrate!
Source: GIPHY
The Rest of the Reconciliation
The rest of the reconciliation should be pretty straightforward. We need to connect to the data source that contains the internal billing data and coerce the correct data types and formats to match the types and formats in the external data. Then, finally, aggregate/de-aggregate the data to match the external data. In this example, using the Summarize tool, the internal data is aggregated at the Date, Client, Product, Quantity, Price, and Total level to match the format present across the invoices.
With this, we are ready to join the invoice data and detect some billing variances!
Right off the bat, there is one potential pitfall to avoid. Because we are trying to detect variances, we need to be careful about which fields we join on. Variances are likely to arise in Price, Quantity, and Total, but we can measure those differences by taking the difference between those quantities in the left and right data sources. In those cases, we do not want to join on those to make use of that. However, the Product field is one that may vary between internal and external billing reports. Therefore, by joining on this field, it becomes readily apparent where a discrepancy appears by looking at those records that do not appear in the inner join output from the join tool.
So, with that in mind, we actually care about all three outputs from the join tool, and we want to blend them into the final reports. The left and right join outputs will show when there is a mismatch in the clients, dates, and product descriptions, while the inner join will contain the fields that will be used to determine if there is a pricing, quantity, or total variance. We have all of our bases covered. Lastly, to make sure that we can separate out the in-month vs. historic reports, I have included a check on the maximum date contained in the combined data. This is handled by the Summary and Append Fields tools.
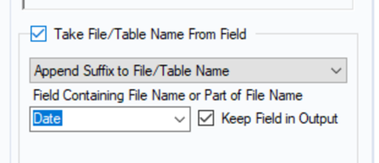
All that remains is to use the Formula tool to check for the differences in the numeric fields, filter out the records with no variances (boring), separate the in-month and historic records, and then use the Union tool to capture the non-numeric sources of variance. One last little trick to make this easy for housekeeping is this:
This setting is a little hard to see in the File Output tool. This appends the value in the Date field in the data to the filename, ensuring that nothing gets overwritten accidentally, you get clear report dates, and you get a complete record of the historic reports at the point in time they were generated. These are EXTREMELY useful during those pesky audits mentioned earlier.
Final Thoughts
I don’t know if you can tell, but I have previously had some experience supporting a billing team and was responsible for automating as much as possible of our monthly billing reconciliation process. While I was able to make great strides in much of our work, one serious stumbling block was that we were never really able to automate the ingestion of many of our accounts’ reports because they were delivered in PDF format. It never even occurred to me it was possible. I realized that with AIS, this process would have been automated in less than a day or two and would have saved countless hours of work with a much higher success rate, increased transparency, and improved record keeping.
While the attached workflow and the guide above will provide useful instruction on how to solve this relatively small problem – 3 clients, 3 months of data, internal data.xlsx – this approach is much more extensible. What if, instead of 3 clients, you had hundreds? You could group by PDF format instead of client and address the volume by having a pipeline for each format (assuming some overlap in formats among clients). What if, instead of 3 months, you had 15 years? No change would need to be made apart from any quality-of-life filtering of ancient data to keep the workflow running quickly. What if, instead of a single flat file for your internal data, your data lived in a SQL database, a google sheet, cloud storage, or all three? Alteryx designer has you covered with the ability to connect to over 60 different data sources and types. The example is small and a little limited, but the possibilities are genuinely astounding. I might have actually automated myself out of a job if I had this.
Notes
While you can download the workflow here and get started immediately, there are some steps you need to take to get it working optimally on your machine. First, you will want to make sure to import all of the assets associated with the packaged workflow and make sure to note the directory into which you import these assets. Once you open the workflow, you will see ( ! ) over a few of the Input-related tools. To correct this, update the file paths to reflect the location of the imported data. Lastly, you will need to download the additional client PDFs that cannot be included in the packaged workflow located on the same community page as the packaged workflow.
You must be a registered user to add a comment. If you've already registered, sign in. Otherwise, register and sign in.


