In my previous blog in the Customer Analytics series, I went into detail about the specific lines of business where insight from customer analytics is being used, and what objectives have been set. Now, let’s turn our attention to the first of three challenges we uncovered, which can best be summarized as getting and then working with the data you need to do your analysis.
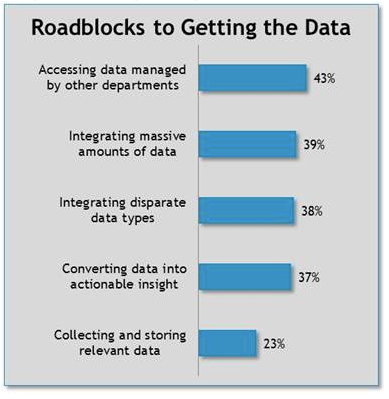 First, there’s the challenge of getting access to the data in the first place. Sometimes organizational structures inhibit the easy sharing of information. One department might collect information about point of sale records, another might collect customer service data, and another might look at inventory levels. This is fine, as long as they are willing to share this information, but as the survey results show; this is not always the case within many organizations.
Then, assuming you can get access to the data there’s the challenge of actually doing something with it. For many organizations, the sheer volume of data causes significant problems. In some cases, it’s a time problem because they try to use tools that weren’t designed to handle this volume of data, and the analysis takes hours or even days in some cases. We have customers who talk about the old, pre-Alteryx days of having to start a data blending or analytics project on a Friday night and hope that it’s done when they come in on Monday morning. And, in some cases the volume of data just causes the analysis to fail; such as when you reach the 65K row limit in Microsoft Excel.
Many respondents also reported challenges of dealing with different data types. This is related to the primary problem where each department collects their own data in whatever system or format is optimal for them. For example, we have most of the wireless service providers in the US as clients, and there’s a lot of insight to be gleaned from location-based device call logs about how subscribers use their cell phones, tablets, etc. The engineering department collects these Call Detail Records (CDRs) in a very technical format, and even if the marketing team were to get this data there wouldn’t be much they could do with it, unless someone already created a way to cross reference the data with some sort of non-technical subscriber data, such as billing records.
The last challenge points to the bigger issue – actually getting some value from the data. Maybe you can get access to the data you need in a format you understand, and have the necessary tools to process the data quickly. But, unless you can blend the data together is a way that adds real business value, you’re really not doing analytics. You’re simply taking a bunch of smaller data files and making one big data file. To be clear, this is fine if you’re using something else to process the data, and many clients use Alteryx for just that – data blending. But ultimately the goal is to get business value, and as the survey results show, many can’t reach that important final step.
VF Corporation is a perfect example of a company who faced such a data integration challenge. In 2009 they started a massive undertaking with their retailer partners to improve their ability to get the right products to the right retailers at the right time—no matter where the retailer was located. But with 10,000 retail locations and more than 100,000 SKU’s across all their brands, connecting the dots between the various systems and file formats their partners used and their own internal systems was no easy feat. Check out their case study to learn more about this challenge and how they were able to overcome it.

Customer Analytics Blog Series: Perspectives from Industry Leaders

Bob Laurent
Director of Industry Marketing