Engine Works
Under the hood of Alteryx: tips, tricks and how-tos.- Community
- :
- Community
- :
- Learn
- :
- Blogs
- :
- Engine Works
- :
- Saving Time With Advanced Excel Outputs
- Subscribe to RSS Feed
- Mark as New
- Mark as Read
- Bookmark
- Subscribe
- Printer Friendly Page
- Notify Moderator
Anyone who has spent time working in financial reporting and analytics knows the fun that comes with closing the books and disseminating the reports to the eagerly awaiting leadership and partner teams.
Despite numerous contenders, Excel has remained a stalwart in the finance industry. As a Professional Services Engineer, I am regularly involved with clients looking to optimize their reporting and analytics (largely Excel) processes. There is a wealth of incredible examples and resources available to solve some of the more difficult undertakings. In this article, I want to share with you an Alteryx method to solve a common time suck when it comes to Excel reporting.
Use Case
Imagine you are a financial analyst at a national accounting firm. One of your tasks at the close of each month is to compile and generate an Excel formatted output report for each state as well as an aggregated report at the Divisional level (East, Central, West). If you’ve been responsible for work like this, then you know that manually splitting out data into more than a few spreadsheets can be mind-numbing. Let alone when you must ensure that the formatting remains intact.
This business problem would certainly be well suited to a business intelligence tool like Tableau that would dynamically allow for slicing and analyzing data. However, this is not always an option for various reasons. It often comes down to that these are skilled finance professionals who like getting the report in Excel, where they are very comfortable navigating the numbers and logic.
So! Let’s take a look at one approach that I modified from an actual client solution. Note that this has been modified to use a public dataset that will illustrate the same principles.
High-level use case structure
Your partner data team has just finalized the combined output of all the countries.
- Read in the .CSV file
- Create a copy of the formatted Excel file for each split in the data
- Use the country as the file name
- Split the combined data into the matching report for that country
Tools needed:
- Data Cleansing
- Summarize
- Formula
- Select
- Sort
- Block Until Done
- Blob Input/Blob Output – The star of the show that will be responsible for duplicating the formatted Excel template-like file
Process
First, you need to read in the cleaned data—in this case, a CSV that has all the output values consolidated into one output file. There are two main steps, where the first step needs to be completed before the second.
1. Step 1 – The first step is to use the data to generate a unique list of country values, which will then be used to make as many copies of the template file.
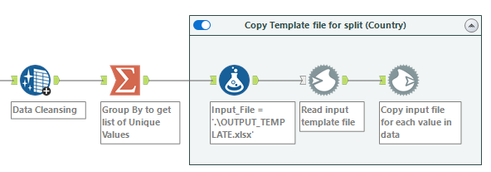
a. Using the input data file, we want to create a list of unique country names by using ‘group by’ in the Summary tool. This list will be used to determine the number of output file copies generated.
i. Note: This makes this process dynamic in that the values in the data will determine the number of output files. So, for example, if the business expands to a new state in the US and we have data for that new state, then a new report file will be generated for that state without modification to the workflow.
b. Using the formula tool, we will specify the location of the input Excel template file.
c. Copy the formatted Excel template file for each of the data splits (country).
i. Use the Blob Input and Blob Output tools to copy the Excel file (blob = binary large object) into multiple files using the split as the file name.
ii. This step duplicates the template file and also renames the file to match the data split (state).
2. Step 2 – Now that the template files have been duplicated a number of times to match the unique countries, the next step is to populate the reports with the appropriate data.
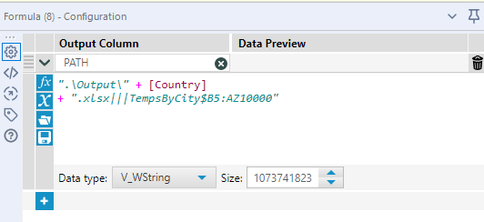
a. Formula tool – This tool specifies the output location of the multiple report files. It also dynamically uses the values in the data to match the Excel file duplication in Step 1. I am using the formula tool to define the file location, name, and even Excel parameters:
i. The [Country] variable will replace the value in the “Country” column as the file name.
ii. The value after the three pipe ||| characters specifies which Excel sheet to write the values to.
iii. The values following the dollar $ sign specify the Excel cell range where the values will be written. This is especially useful for formatted Excel files because the template can hold all the formatting, and when Alteryx writes in the values, that formatting will remain.
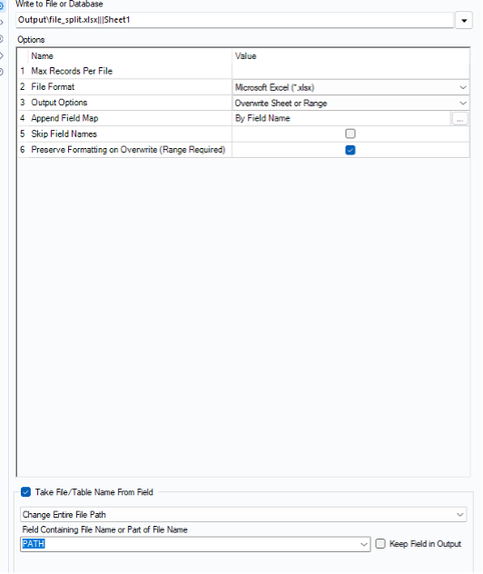
b. Output Data – The output data tool has a very helpful feature where you can use one of the fields in the data to determine where the proper data will be written to.
i. In this case, we have already created the PATH field in the previous step that has all of the information needed to place that row of data in the appropriate output file.
3. Since these steps need to be completed in order (generate the output files, and then write to the output files), we need to enforce the order by using the Block Until Done tool. This tool completes the first output anchor before beginning the subsequent output anchor processes.
The result should produce an Excel file for each split of the data using one of the fields in the data. This Excel file will have the report formatting based on the template file that you have the workflow duplicate.
Conclusion
In this process, we used Alteryx tools to make copies of an existing file (formatted Excel template). The main benefit is that it can be useful to work with existing business processes. In the case of this example, we wanted to use an existing report that has been formatted in Excel and create a number of copies that can each have different slices of the data. This is especially useful for generating a higher volume of output reports.
This example is designed for Excel reporting, where the user wants multiple copies of the Excel file and the ability to write specific data into each. However, this process can also be used to copy any file type (PDF, PPT, datafiles), to create and distribute the various copies.
You must be a registered user to add a comment. If you've already registered, sign in. Otherwise, register and sign in.


