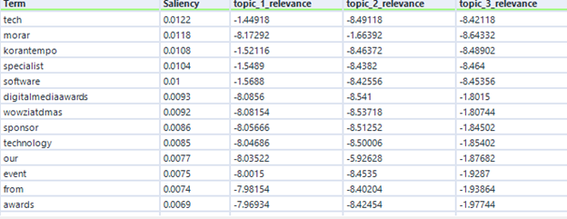
In Part 3 we review the Word-Relevance Summary and visualization data. It returns the two previously mentioned metrics: relevance and saliency.
Saliency
It helps us identify the words that are most informative to identify topics within documents. A higher salience value indicates that a word is more useful in identifying a specific topic.
Salience is always a positive value and does not have a maximum. It is designed to see specific words in relation to the totality of documents that we are analyzing; a value of 0 indicates that a word is present in all topics.
Relevance
It is a metric used to order words within topics. It helps us to identify the most appropriate words for each topic, and reflects the level at which a word belongs to a topic. The higher the value for a given topic, the more important that word will be for that topic.
Both metrics show relative values that we can use to describe and understand a specific topic. For a deeper dive, see Getting to the Point with Topic Modeling - Interpreting the Results.

Assigning Tags to Topics
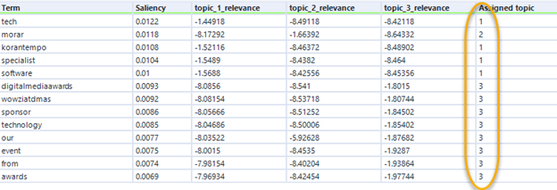
Assigning tags to topics allows us to label documents for categorization. Select the R output of the Topic Modeling tool and insert a Formula tool after, to be able to extract the topic to which each word belongs.


The MaxIDX formula will give us the maximum value among the three relevance fields. The result is an integer, at the end we add 1. In this way we will have assigned a topic for each word, along with its relevance.

The next step is to add a Sample tool to select only the first N words of each topic we create.


We get the 3 most prominent and relevant words:

The next step is to create the tags based on the topic terms. To make it dynamic, use a Summarize tool to create a concatenated field with the three words to serve as a label for the topic.

Using a Find and Replace tool we can change the topic numbers to text labels that make more sense for business users consuming this analysis.


Now we have each document tagged with the topic that belongs to it. With that we can summarize the topics to count how many documents belong to each category.

Visualize each topic in a custom word cloud
To categorize each document within its topic, we will use a similar process. Taking output D from the Topic Modeling tool, we add a Formula tool to it. Use the MaxIDX() function to obtain the topic that has the most relevance for each document.

Filter each topic to view it independently.
Using the Word Cloud tool, we will set up the visualization.

First, select the field that we want to visualize. To customize the word cloud, select the corresponding option.

There are several options for customization:
- Choose a color for the background.
- Select the maximum number of words to evaluate
- Resizing
- Masking means that we can define the shape of the word cloud.

To take an image as a template, add a Blob Input tool (binary large object) from the Developer tool category and select the path where the file is located.


Once this is done, in the Word Cloud configuration, the Blob option will appear in the mask option. Run the workflow and the word cloud is presented. In this case I used the twitter logo to shape the report.


The last part in this series will demonstrate how to export a trained topic model to score new items and speed up the process.


