To model or identify topics within documents, we use the LDA (Latent Dirichlet Allocation) algorithm. It basically creates groups or clusters of words according to the word usage patterns they have.
It is very useful for organizing and contributing findings for the understanding of large amounts of unstructured text and making sense of collections of documents, identifying topics, and organizing texts in groups.
The configuration options are as follows:
Start by selecting the text field to process and the number of topics that we want to generate. Typically, this is a step that requires several iterations and a trial-and-error process to find the optimal number of topics according to the objective we are looking for. Start with three. If that doesn't look like enough, increase the iteration number. If it looks like too may topics, decrease the number.
It requires an iterative process because it uses an unsupervised and fuzzy model, which makes it easier to start using it since it does not require training but requires interpretation of the topics by the user.

The Output Options are described in detail further below, and also in Getting to the Point with Topic Modeling Part 2 - How to Configure the Tool. They are:
- Interactive chart
- Summary of word relevance

Next, are Dictionary options.Here we choose the words that we want to consider for our analysis.
- Min Frequency is the minimum frequency at which a word can appear in a body of text before the LDA tool ignores the word. In the image below we are left with the words that appear in at least 1% of the corpus.
- Max Frequency specifies the upper limit to include a word. Below, we update the setting to only consider those that appear in less than 80% of the corpus.
- Max Words limits the number of words used for the analysis.
The initial recommendation is to leave the tool's default values, to obtain the best result.

Finally, the LDA Options:
- Alpha: It is the density of topics within each document; if we increase that parameter, the algorithm will recognize more topics.
- Eta: Represents the density of words required to create a topic; the higher the value, the more words are needed to identify a topic.

Here also the advice is to keep the recommended options for an optimal result. Or as a starting point, based on your own knowledge of the business use case.
Results
Selecting the R output anchor (Report), we can see the interactive visualization of the results.

The interactive chart has two parts, a map with the distance between the topics, and some metrics for evaluation. The Intertopic Distance map shows us how similar the identified topics are, and we can see if there is an overlap in some terms, i.e. if they are separated enough for our analysis.
The topics that are closer to each other have more words in common.
To graph it, principal components are used to reduce the dimensions and to be able to visualize it in a two-dimensional graph.
In the below image, we have a map with 3 topics, and we can see that they are clearly differentiated from each other: the size of the circle represents the number of words that each topic contains.
When we click to select a topic, it changes color and presents the words it contains on the left side of the report.

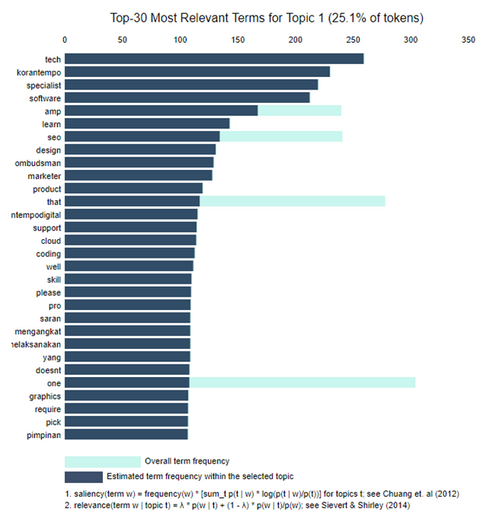
On the left side of the interactive report are the 30 most relevant words for each topic, where we can evaluate the content of each topic and select the words that we consider most convenient to assign as a topic to make it easier for end users to consume.
The bars indicate how much a word appears within the total number of documents.

Saliency is a specific metric that is defined at the end of the visualization and can be thought of as the metric used to identify the words that are most informative or useful for identifying topics. A higher prominence indicates that the word is more useful in identifying a specific topic.

When a topic is selected on the topic distance map, or a topic is specified in the top panel, the bar graph changes to show the most prominent words included in the selected topic.
A second, darker bar is displayed above the total frequency of the word and shows the topic-specific frequency of words that belong to the selected topic. If the dark bar completely overlaps the light bar, the word belongs almost exclusively to the selected topic.

When a word is selected in the bar graph, the topics, and probabilities for each topic of that word are shown on the distance map between topics, so you can see what other topics share that word.
For example, the word seo appears below in all three topics:

While the word mediaawards below only appears in topic 3.

This means that we can use the words that have the highest frequency within each topic to label it; as in the previous case, topic 3 would be tech, / korantempo / specialist.
If we adjust the bar with the relevance metric (how much that a particular word belongs in that topic), it will show us the terms that are potentially rarer and more exclusive for the selected topic.

In Part 3 of this series, I will describe the Word-Relevance output option, and move forward with the whole process of topic identification.


