Data Science
Machine learning & data science for beginners and experts alike.- Community
- :
- Community
- :
- Learn
- :
- Blogs
- :
- Data Science
- :
- Building Explainable AI: How to Get Prediction Exp...
- Subscribe to RSS Feed
- Mark as New
- Mark as Read
- Bookmark
- Subscribe
- Printer Friendly Page
- Notify Moderator
Being able to explain a model’s predictions is a major challenge for Data Scientists. Luckily both Alteryx ML and Intelligence suite (IS) can do the hard work for you. This article will briefly introduce prediction explanations, why you want them, and how to get them in both Alteryx’s Auto ML products.
Source: GIPHY
Important prerequisites
You need to be familiar with what machine learning models are and their use cases. For the Intelligence Suite section, you need knowledge of how to use the Python tool.
What are prediction explanations?
Prediction explanations are a key aspect of creating an explainable AI. Just knowing the significant features in a dataset is not enough to explain why a model made an individual prediction. What is needed is a qualitative explanation of each prediction that anyone can understand. Each explanation should contain the top features influencing that prediction and to what degree the feature contributed, whether that’s positively or negatively. The image below shows an example of three prediction explanations: the model’s prediction, the actual value, and the top four features influencing that prediction. Each feature is given a plus ‘+’ or minus ‘– ‘depending on if it contributed to a positive (yes prediction) or negatively (a no prediction); the number of pluses or minuses denotes the impact it had on the prediction.
There are many advantages of having a prediction explanation. For one, validation, by looking at an explanation for individual data points, an onlooker can understand whether that prediction makes sense. Moreover, it fills a business's need for transparency. Explanations need to be understandable by anyone. Coefficients and R^2 won’t do when explaining to a stakeholder, for instance, why a model predicted a hospital patient’s 93% chance of readmittance or why did the model miss a particular instance of fraud?
What will we be modeling?
For both Alteryx ML and IS walkthroughs, we are going to use a sample dataset on user surveys. The target of the dataset is the responder column which identifies customers who did and who did not respond to our marketing survey (encoded as 1 for yes, 0 for no). Other columns are shown below:
From this dataset, we will create a model which can identify ahead of time which of our new customers are a viable target in our next survey campaign and, importantly, explain why particular customers are seen as viable or less viable.
Getting explanations in Alteryx ML
Alteryx ML is a fantastic AutoML platform, and as such, It can automate as much of the modeling process as you want, including getting prediction explanations.
The first step is to upload our data to Alteryx ML. This can be done directly in Alteryx ML UI or, like in this example, uploaded via the Machine Learning Send tool.
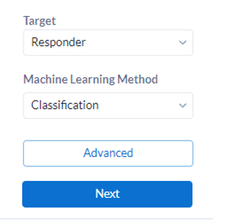
Next, set the target as the responder flag, click next, and then let Auto ML generate multiple potential models.
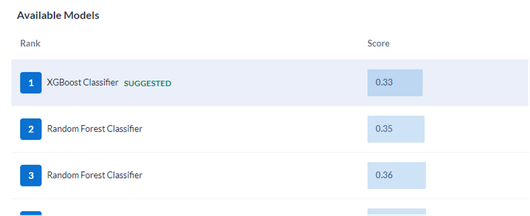
After reviewing the Auto ML leader board, the XGBoost Classifier Model was selected as it was the most accurate.
In the Evaluate Model tab under insights, you can find the prediction explanation tab with everything all set up for us! How easy was that!
When entering the tab, Alteryx ML will generate the explanations using SHAP (SHapley Additive exPlanations) method. The prediction explanation section, by default, shows the best (lowest error) and the worst (highest error) predictions.
Looking at the initial prediction explanations from the dataset, you can learn quite a lot. For instance, the highest error predictions share the same city. This may indicate that to increase the model’s accuracy, more geospatial information may be needed for the model to understand the data fully. The results also show how the factors affecting each prediction differ on an individual level, and we gain the advantages mentioned at the start.
Intelligence Suite
Getting prediction explanations in IS requires a bit of code, unlike Alteryx ML; however, fortunately, IS is built on top of Alteryx’s open-source EvalML library! EvalML, along with numerous other features, has an inbuilt prediction explanation system. The prediction explanation functions themselves utilize SHAP and LIME (Local Interpretable Model-agnostic Explanations) methods to receive row-level prediction explanations on models built in IS.
Source: GIPHY
The assisted modeling tool can create our model in a few clicks. Connect the data to the assisted modeling tool and walk through the data cleaning and feature selection steps. Once complete, you should get the screen below, where you can choose your best model.
In this case, logistic regression was the best model. For this next step, go to the model’s options and select “Export to Python.” This will generate a Python tool containing all the elements of the pipeline made, from data selection to missing value imputation.
Now you can add the prediction explanation code to your pipeline. Open the Python tool in the Jupyter notebook and add the bottom two lines, as shown in the image below. This will import both Pandas and the prediction explanation functions from the EvalML library.
from ayx import Alteryx

from ayx_learn.evalml import *

from ayx_ml_toolkit.entities import *
from ayx_ml_toolkit.jupyter_nb import *

import numpy as np

#Have to import these two
import evalml as ev
import pandas as pd
Further down the pipeline, under the fit function, add the explain_predictions_best_worst function. This will return the prediction explanations. In the parameters, pass the data, the true values, how many explanations you want, and the data type to output.
pipeline_entity.fit()
results = ev.model_understanding.prediction_explanations.explainers.explain_predictions_best_worst(pipeline,training_data_df,y_true=Alteryx.read("#1")['True False'],num_to_explain=30 ,output_format='dict')
Finally, add the code snippet below to write out our prediction explanations to output 2 as a table to Alteryx.
data, column_metadata = build_fitted_model_outputs(pipeline_entity)
Alteryx.write(data, 1, columns = column_metadata)
Alteryx.write(pd.DataFrame.from_dict(results),2)
Now that the code is added, all that is needed is to parse the results into a tabular format. This can be done using Regex below:
{'rank': {'prefix': '(\w+)', 'index': (\d+).*predicted_value': (.*), 'target_value': (.*), 'error_name': 'Cross Entropy', 'error_value': .*}, 'explanations': \[{'feature_names': \[(.*)\], 'feature_values': \[(.*)\], 'qualitative_explanation': \[(.*)\], 'quantitative_explanation':
With that, you now have your prediction explanations for each row!
The results table shows the top 5 highest contributing features for each row’s prediction alongside its value and a qualitative explanation of how much it affected the result, be that positively ‘+’ or negatively ‘-.’
Source: GIPHY
Conclusion
Getting prediction explanations in Alteryx ML is incredibly easy, and they provide fantastic insight into what causes individual predictions allowing you to better understand and explain your models.
Moreover, Intelligence Suite’s integration with EvalML unlocks a lot of great functionality. Want to learn more? Check out the EvalML and Auto ML documentation for an in-depth dive into prediction explanations as well as other awesome functionality available to both platforms.
Links:
Machine Learning Platform | Alteryx
Alteryx Intelligence Suite | Alteryx
Home — EvalML 0.52.0 documentation (alteryx.com)
alteryx/evalml: EvalML is an AutoML library written in python. (github.com)
API Reference — EvalML 0.52.0 documentation (alteryx.com)
You must be a registered user to add a comment. If you've already registered, sign in. Otherwise, register and sign in.


