As we readied Tableau 8 for release this Spring, we continued to see customer interest in, and success with, a new way of working with data. For us at Tableau, helping people see and understand data is our sole mission. Modern analytics solutions need to be accessible and understandable by people of all expertise levels, flexible in working with data from a variety of sources, nimble in extending and combining data, and analytically rich and diverse in the types of questions which can be answered with data. Modern analytics solutions recognize the fact that data comes from many sources and in many formats. It can ingest structured, unstructured and semi-structured sources seamlessly, from older sources as well as new ones such as Hadoop. The new generation of analytics products create meaningful output, deliver transparent predictive analytics and can quickly deploy visualizations for broader user consumption and discovery.
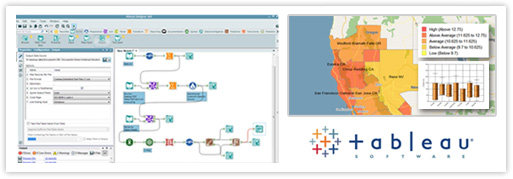
Tableau has been on the vanguard of enabling the new way to work with data. We provide a revolutionary data visualization and discovery platform. It is easy to use and it makes deep analytics insight accessible to business users without a deep background in analytics. For these users, and for more data analysts, visual representation of the data provides the fastest and most intuitive insight. As we say in our whitepaper, Visual Analysis for Everyone, the right presentation makes it easy to organize and understand the information. Tableau has driven this with a number of patents and technologies that simultaneously describes how to query data and how to present it visually. The result is that Tableau can be used from simple visual analysis to mission-critical tasks that require very large data collections and deep multidimensional visual analysis.
In Tableau 8, we made an even deeper commitment to how people can access and understand information. We made authoring accessible on both the web and on mobile devices. We added more data sources with Salesforce.com and Google Analytics. We added more ways to view content with Treemaps and Bubble Charts. And we created an API to enable partners to drive meaningful integration with our products. As part of this release, we are happy to announce Alteryx was our first partner to directly output Tableau TDE files, our data file format.
For customers, this has meant a tight integration that enables Alteryx users to create analytics results, and launch directly into Tableau to view those results as Tableau visualizations. We see many customers that are using Alteryx for data blending, predictive and geo-spatial analytics, and then pushing those results into Tableau for visualization and discovery. The result is the right data is getting into the hands of business analysts so they can make informed decisions quickly.
It is important that we give users access to the data and the tools they need to make decisions. And the new tools need to be packaged and priced in a way to make them accessible to more users to foster broader adoption within organizations. With Alteryx for Visual Analytics, Alteryx is making data-driven decision making even more accessible.
You can learn more about Tableau and Alteryx for Visual Analytics on this webinar, with Robert Green from my team. Robert, along with the Alteryx team, will outline a path to use Alteryx and Tableau to deliver the most value from your data and analysis, without having to use legacy coding or specialist tools - giving you time that can be spent analyzing instead of waiting for data.
 Dan Jewett VP of Product Management |  |


