Today, we will be brushing our canvas. But I don’t mean painting…
Bob Ross’s wise words still apply here. (Source: GIPHY)
Our canvas is Designer Cloud, Designer Experience, and our brush is a brand-new feature that allows us to highlight our messy data and clean it up in a few clicks!
Read on to learn how the Brushing feature in Designer Cloud can speed up your data cleaning and transformations.
How to Use Brushing
First, open up Designer Cloud, Designer Experience. Once you have data in your workflow, you can highlight any value in the Results Grid to view suggested transformations. Simply click and drag your cursor over the value (or part of the value) that you would like to transform. The suggestions displayed in the panel will be tailored to the data type of your column!
After you select a suggestion for transforming your data, you can edit the configuration before applying it. A configured tool will be added to your workflow when you click “apply.”

As you can see, the Brushing feature allows you to save time and energy by automatically populating formulas. If you’re new to formulas in Alteryx, this is a great way to learn about the functions and syntax. The suggestions also give you a preview of what your data will look like when the formula is applied.
Note: Brushing suggestions are not currently available for Float & Boolean columns.
Examples
Suggestions will vary based on the data type of the column. Below are the four formula suggestion types you will see when Brushing your data. We will use a Netflix movie dataset to identify examples of each one.
Extract Matched Value
All column values that match (or contain) the value you highlight (brush) will be extracted into a new column. This new column will have the same data type as the original column.

In the example above, we can use the extract matched value option to create a new column that identifies which movies and TV are labeled as parental guidance or “PG” of some kind—regardless of the position of that label in the rating column.
Extract First or Last Characters
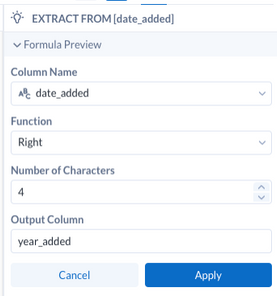
Based on the number of selected characters, the first or last characters from each row in the column will be extracted into a new column. The new column will have the same data type as the original column.

Our movie dataset includes a column for “date added.” If we want to create a column for the year added, we can use the extract last 4 characters option. Additionally, we can click “edit” and name the output column “year_added.”

Since the output column is the same data type as the original column, we would need to use a select tool to change the data type of the year column if we want to treat it as a numeric variable.
Replace Matched Patterns
Once you brush over a value, you can decide what to replace that value with.

In the movie title column, both dashes and colons were used to separate the subtitle. We can brush over the dash and choose the replace option to standardize this. Then, after clicking “edit,” we can replace this character with a colon.
Replace First or Last Characters
Once you brush over a value, you can decide what to replace the first or last characters with for all values within the column.

The “show_id” column contains the character “s” in front of every id in the preview. We can remove the leading “s” using the replace first characters option, keeping it with the default replacement.
Conclusion
In the examples in this article, we created four formulas to clean up our data and prepare it for further analysis without typing out any functions! The Brushing functionality allowed us to interact with the data strictly in the results grid and preview the result of each change before applying it.
You can get started with Brushing today in Designer Cloud, Designer Experience. If you don’t have access to the Analytics Cloud Platform, consider starting a free trial!
Special thanks to @MDevetski for her contributions to this article.


