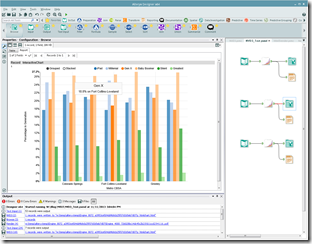
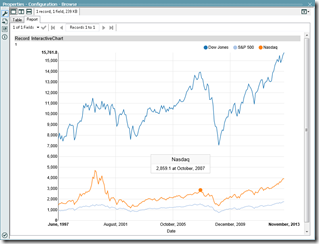
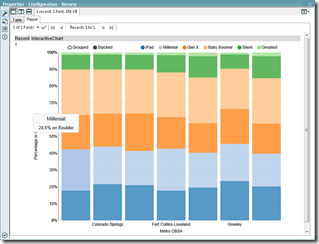
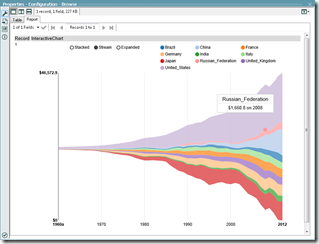
 As I am drawing to a close in exploring interactive charting in Alteryx, I wanted to create a macro for the people who say “Can’t I just have it now?” One of the great things about Alteryx is the macro system and the fact that you kind of can have it now. Once again, I am wrapping the NVD3 library as a starting point. The macro has 4 different chart types exposed: Line, Bar, Area and Scatter Plots. I produced samples for the 1st three. NVD3 supports lots more types of charts, but most of the rest take more specific user input or only work for a limited number of dimensions.
 For this example I wanted to keep it simple. Obviously if we were to actually productize a charting system like this, there would be lots more options, and probably not even limited to NVD3.
Of course, since this is just a prototype, there are some caveats:
- The biggest caveat is that you can only have 1 interactive chart in a document. It would be possible to work around this in a prototype, but it would take a lot of detail and care in the macro. I try not to spend more than a workday on a blog post, and that would send me over budget. The issue is in the JavaScript: The IDs of items would need to be generated randomly so there were no conflicts and the D3 and NVD3 code would only need to be inserted into the document in the 1st chart. As it is now, the JavaScript expects that it is standing alone.
- I didn’t implement higher resolution printing. If you are interested in printing, you can use the module from Part 2: HTML5 Visualizations. I figured this exercise is primarily about interactive charts and besides, since this is an exploration, there is no a lot of point in solving problems that have already been solved.
- All the incoming fields, except for the one you pick for labeling the x axis will be charted. The names on the chart will be the field names. In general, you will want to use a Select tool before the NVD3 tool. Obviously a real charting tool would have to have a better UI.
- And just to say it again, this is prototype. Eventually we might do something more integrated, but for now this is just for show.
So, if you want the macro and sample module, you can go ahead and download it here, otherwise read on for more details.

Technical Details
Since the goal was interactivity, the rendering is a lower priority. This means that I left the D3 transitions in place for the cool animated painting. The problem with this is that some charts aren’t finished painting before we capture the screenshot for rendering to non HTML targets. In order to work around this, I have a delay of 1,500ms before grabbing the screenshot. I suspect that for some data sets this won’t be long enough. If it looks like you only get half a chart when rendering to PDF or something, go in to rasterize.js and change the timeout. For a productized verion of this, we would want to turn off the transitions for static rendering, but that would involve some changes to the underlying D3 library.
In order to make the interactivity fairly portable, I embed the full source code for D3 and NVD3 into the report snippet. Anything else would make it hard to move objects or the results around. This is something that would need to change for a non-prototype implementation. The reporting engine would have to know about dependencies and deal with them in a smarter way.
Otherwise, there is nothing too new in this macro, it is just the combination of the last few week’s work. Next time I will wrap up this series and talk about how it might be integrated into Alteryx in the future.
Thanks for reading,
ned.


This post originally appeared at: http://inspiringingenuity.net/2013/11/11/alteryx-a-reusable-nvd3-macro/

 For this example I wanted to keep it simple. Obviously if we were to actually productize a charting system like this, there would be lots more options, and probably not even limited to NVD3.

