Motivation
The last Server post showed some tips and tools for troubleshooting a Server, and this time around we’ll dig in a bit deeper, using concrete examples from a multi-node Private Server. Alteryx is a fantastic tool for ad-hoc log exploration, so we’ll build out a simple log parsing module and demonstrate usage including examining how the Server processes a module and looking for suspicious user login behavior.
We made several Server-specific advances in the Alteryx 10.5 release related to logging and automation, and we’ll see a few of them in action. Granted, these aren’t major new 10.5 features like data connectors or packaged tool deployment via YXI files, but more minor improvements geared toward making the Server easier to automate and maintain.
There are several precursor posts that help to set the stage for this one, and if you haven’t already looked through the intro to the Server Command Line and the Tips and Tools for Troubleshooting articles this is a good time to do so. We’ll be building on the techniques covered in those posts and glossing over details covered previously.
My hope with this post is you’ll join along to build up your own ad-hoc log exploration module in Alteryx using your logs as the input sources, asking your own questions along the way. If you haven’t yet downloaded a copy of the 10.5 release, this is a great chance!
Preparation
1. Log Locations
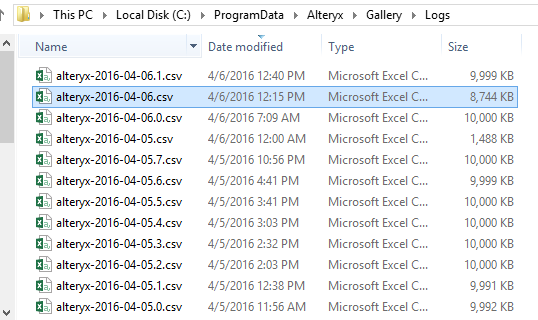
To start, remember that there are two sets of logs on a Private Server including those for the front-end Gallery and the back-end Alteryx Service (the “Service”). By default, the Gallery logs are located at C:\ProgramData\Alteryx\Gallery\Logs\ and the Service logs are located at C:\ProgramData\Alteryx\Service\AlteryxServiceLog.log. For both the Gallery and Service logs, any rotated logs will be located in the same folder as the active log, and marked with the timestamp at the time of rotation.
As an example, depending on the log level and the level of Server activity, the log folders may contain “many” rotated logs:
2. Tool
Alteryx!
By using Alteryx, the answer to common log-parsing questions is easy, just "Yes." Can these logs be joined with other data? Yes. Can we filter by user/date/message? Yes. Can I run log-analysis workflows on a regular cadence via the Scheduler and have Alteryx automatically email results? Yes. And so forth.
Building a skeleton log exploration module
Loading Server logs into Alteryx is straightforward, especially thanks to several improvements we made in the 10.5 release including consistent log headers, UTF-16 file encoding and CSV-compliant formatting. We’ll start building our ad-hoc query module with a pair of input tools, one for the Gallery logs and the other for the Service logs, from which different log exploration flows can be built. Both Import Tools should be configured as CSV importers using filename globbing, UTF-16 character encoding and support for longer field lengths (in case the logs contain errors we want to capture all the details):
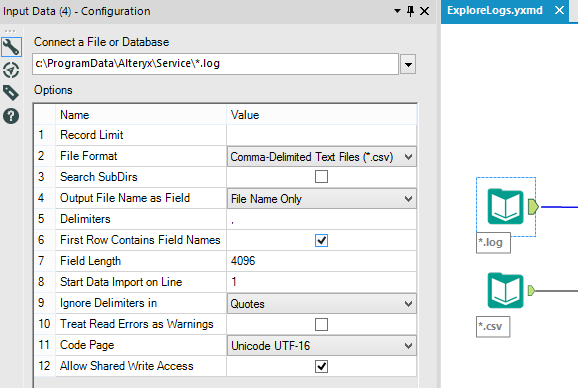
Note that enabling the option Allow Shared Write Access lets Alteryx consume the live logs being actively written by the Server without interrupting normal Server operation. Also note that choosing Output File Name as Field is helpful when dealing with “many” logs as it ties each row in the input streams back to the file it came from, which can aid when more advanced diagnosis is required.
Combine the two log streams
The two different log types share numerous common fields (e.g., UserId) and use consistent field names where they do overlap. There are a number of differences between the logs, however, reflecting the different roles between the front-end (Gallery) and back-end (Service) systems. When examining logs, we’ll often just use one of the two log streams, but in some cases it’s exceptionally useful to combine the log streams in Alteryx for a consistent, time-based view of Server activity.
Combining the log streams requires a Union Tool, and we’ll accept the default option to Auto Config by Name which will align common fields from both log streams and append extra fields as necessary:
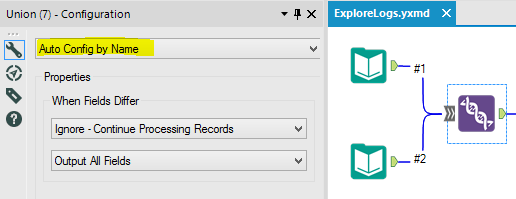
Note too that your processing module will likely contain multiple Select Tools to turn off lesser-used fields and improve the signal-to-noise ratio, but it depends on the types of questions you're asking of the logs.
What time is it anyway?
You’ve probably noticed that many Service log entries contain two different time stamps, a Date and a RemoteDate, both of which use UTC time format. Remember that the Server comprises multiple processes spread over multiple physical machines, and each of these processes generate their own log data, some of which will be reported back to the Controller:

Without getting into too much detail about the significance of these two different time stamps, it’s sufficient to state that the RemoteDate is important because it represents the time that a remote system/process generated a log message, whereas the Date represents the time at which an event was written to the log file. And, in the case that both are present in a single log message, we want to favor the RemoteDate.
Going back to our module in progress, using a Formula Tool, we create a separate column called MessageDate which is the RemoteDate if it’s present, and Date if not. This MessageDate field is the field upon which we’ll sort the log data, as it represents the actual time that an event occurred:

Caveat: Timestamps
Synchronizing log events across multiple machines using timestamps can be error-prone as computer clocks aren’t guaranteed to be perfect (although, I suppose it is possible you’re reading this post from a workstation inside the NIST building…) and each machine in a Server deploy may have a different concept of “wall clock time.” Therefore, when setting up a Server (especially a multi-node Server), it’s critical that the machines are all synced to a common time source using the Network Time Protocol (NTP). Oftentimes the NTP server will be a dedicated machine on the local network, but each machine may be configured to synchronize time independently. Regardless of the exact configuration, as long as NTP is enabled the time drift across machines will be minimized.
Finalizing the module
The last thing we’ll add to the log parsing module is a final Select Tool to put our new MessageDate field first (plus remove some lesser-used fields) and a Sort Tool to organize by that field:
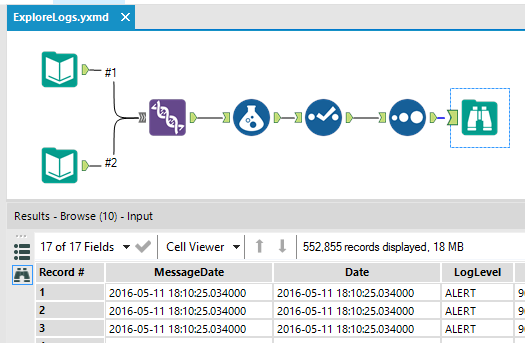
In true Alteryx fashion, we’ve built up the basic parsing module in a handful of tools and now we can use the module to do More Interesting Things (MITs), adding short tool chains to ask questions of the logs.
Example One: Tracing a single App execution event
When a user interacts with an Analytic App on a Server, the extensive log trail left by the combined Gallery and Service logs gives insights into how the Server operates. We’ll use these combined logs to look at a single App execution event, starting with the user first requesting the UI for that App and ending with the successful execution of the App and results presentation to the user.
To start, let's first first trim down the combined log stream using a Filter Tool include events starting at a known time (which in this example happens to be the time before which I started this particular experiment). In practice, the starting time will likely be determined by some other external factor such as the time a failure was suspected. We’ll also filter now by the particular user we’re interested in:

This simple example is a good chance to see how the Gallery generates a unique RequestId for each logged client interaction, and, when possible, supporting operations in the back-end Service will also be logged with this same RequestId. For example, when the client first requests the GUI interface for the Analytic App, we see the Gallery logging a GetAppInterface call, which is immediately followed by a request to the Service to retrieve the interface via a GetWebWizardDocument call. Note how the RequestId is identical across both log streams:

After the Gallery displays the interface for the Analytic App, the user configures the App as desired and presses the “Run” button, at which point the Gallery collects the user’s answers and asks the Service to execute the job. A job execution request includes the id of the app to be executed, answers to any questions that App needs answered, and other supporting data as needed by the exact App being executed.
In the logs, we can see the Gallery create the job and enqueue the job for execution by the Service, and one of the workers (“T1700W8SAHLGREN|1DE48137”) pick up the job for execution:

Once a worker takes ownership of a job, it will run the job to completion. During this time, the Gallery will poll the status of the job, providing feedback to the client while the job is still running, and displaying results when the job is complete. At the same time, the Worker processing the job is also providing feedback on its progress, so the log of the App execution will be punctuated by both the Gallery and the Worker checking in:

When the job completes, both the Gallery and the Service will mark the event. When the Worker finishes its work, the job is marked as “Complete,” which will then be reflected in the Gallery state:

In both of the last two snippets, note that how the RequestId for each of the Worker’s log entries is the same as the Gallery’s RequestId when the user started running the workflow. As a general rule, a single RequestId should only ever be processed by one Worker (as marked by the ServiceId).
Example Two: Is there suspicious login activity on my Server?
Using just the Gallery logs, it’s straightforward to determine who is logging into the Server (UserId) and from where (ClientIP). For each Gallery transaction, the Server logs the current user and IP address, information useful for detecting fraudulent activity marked by a single account being accessed by multiple IP addresses. If these accesses happen within a short amount of time, or by geographically-distinct IP blocks (e.g., determined using reverse-IP lookup in Alteryx), then further investigation into this account's activity may be in order.
From the Gallery log input stream, we attach a Summary Tool to group by UserId, and then by group by ClientIP. This gives us the unique collection of users who’ve interacted with this Server, and the IP addresses from which they originated:

In this simplified example, we see that one user has connected to this Server from multiple IP addresses:
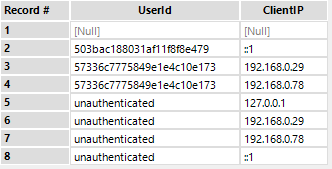
There’s many legitimate reasons why a single user might log in from multiple IPs. For example, perhaps they were using a laptop at home and stopped at the coffee shop on the way to work, or they just flew overseas to a conference, or their DHCP lease renewed. But it could also be the case that the activity is unintentional and the account is being shared, either deliberately or due to a password breach.
In our example, adding a Filter Tool to highlight activity by just this particular user and examining the timestamps indicates that this user was moving very quickly between different machines (2.5 seconds!), so unless they are a gifted Olympic sprinter then another factor may be at play. Depending on how extensive this type of activity is, it might merit a follow-up conversation with the user to establish context and guide further exploration:

Final Thoughts
You've seen how straightforward it is to leverage the power of Alteryx in log exploration, adding simple tool chains to ask interesting questions of the logs. The example workflow used in this post is attached for reference and can be used as a starting point for your own log exploration module.
You have a Server, you have the Scheduler, you have Alteryx, so why not combine them all and look toward automating common log-related processes? To that end, I'd be grateful to learn more about how you're monitoring Server, including successes, missing features/options, or pitfalls/pain points you'd like to see eliminated. Feel free to add a comment here or send me a PM, feedback is greatly appreciated as that's one way we continue moving the product forward together.
Inspire!
This is a perfect place for a shameless Inspire 2016 plug...
There are myriad Server-specific offerings at Inspire this year including an all-day course on Monday and several talks throughout the conference. There will be plenty of Server-savvy Alteryx employees on hand in the Solutions Center all week so if you're new to Server (perhaps, considering your first Server deployment?) or an existing Server user (are you ready to optimize and scale out?), please come and see us. There's a special Server roundtable event in the Solutions Center on Thursday morning, a great chance to grab a free coffee & sweet treats and pose interesting questions to other Server clients and Alteryx folks. And, the Server event is a great precursor to @Ned's deep-dive into the Alteryx Engine Thursday mid-morning, definitely a session you don't want to miss this year!
Thanks
A huge thanks to @GaryS for being a solid sounding board and helping with the examples.