vis·u·a·lyt·ics
/viZH(o͞o)əˈlidiks/
noun
- The joyous union of data visualization and analysis. Visualytics integrates the graphic representation of information into every step of the analytic journey.
The word “Visualytics” gets used a lot here at Alteryx, and not just because it’s incredibly fun to say (although that may have something to do with it). Our obsession with this quirky term is based on all that it allows our users to do. With Alteryx Visualytics you can:
- SEE your data in motion via data profiling
- SHARE your answers using charts & reports
- INTERACT with every insight with dashboards
Let's break down each of these areas...
SEE
Research shows that humans have a 323% improvement following directions (1) when presented with both text and visuals. When you can visualize your data as you manipulate it, you make faster and better decisions about what to do next.
Visualytics provides a profile of your data, allowing you to quickly validate the quality and distribution of your data at each step of the workflow. By validating the data the moment you drop an input tool, you can kickstart the analysis and determine what steps to take next. Visualytics helps you to investigate and pinpoint insights, such as outliers or nulls in datasets. No matter how many steps you take to prepare your data, you can validate your work as you go.
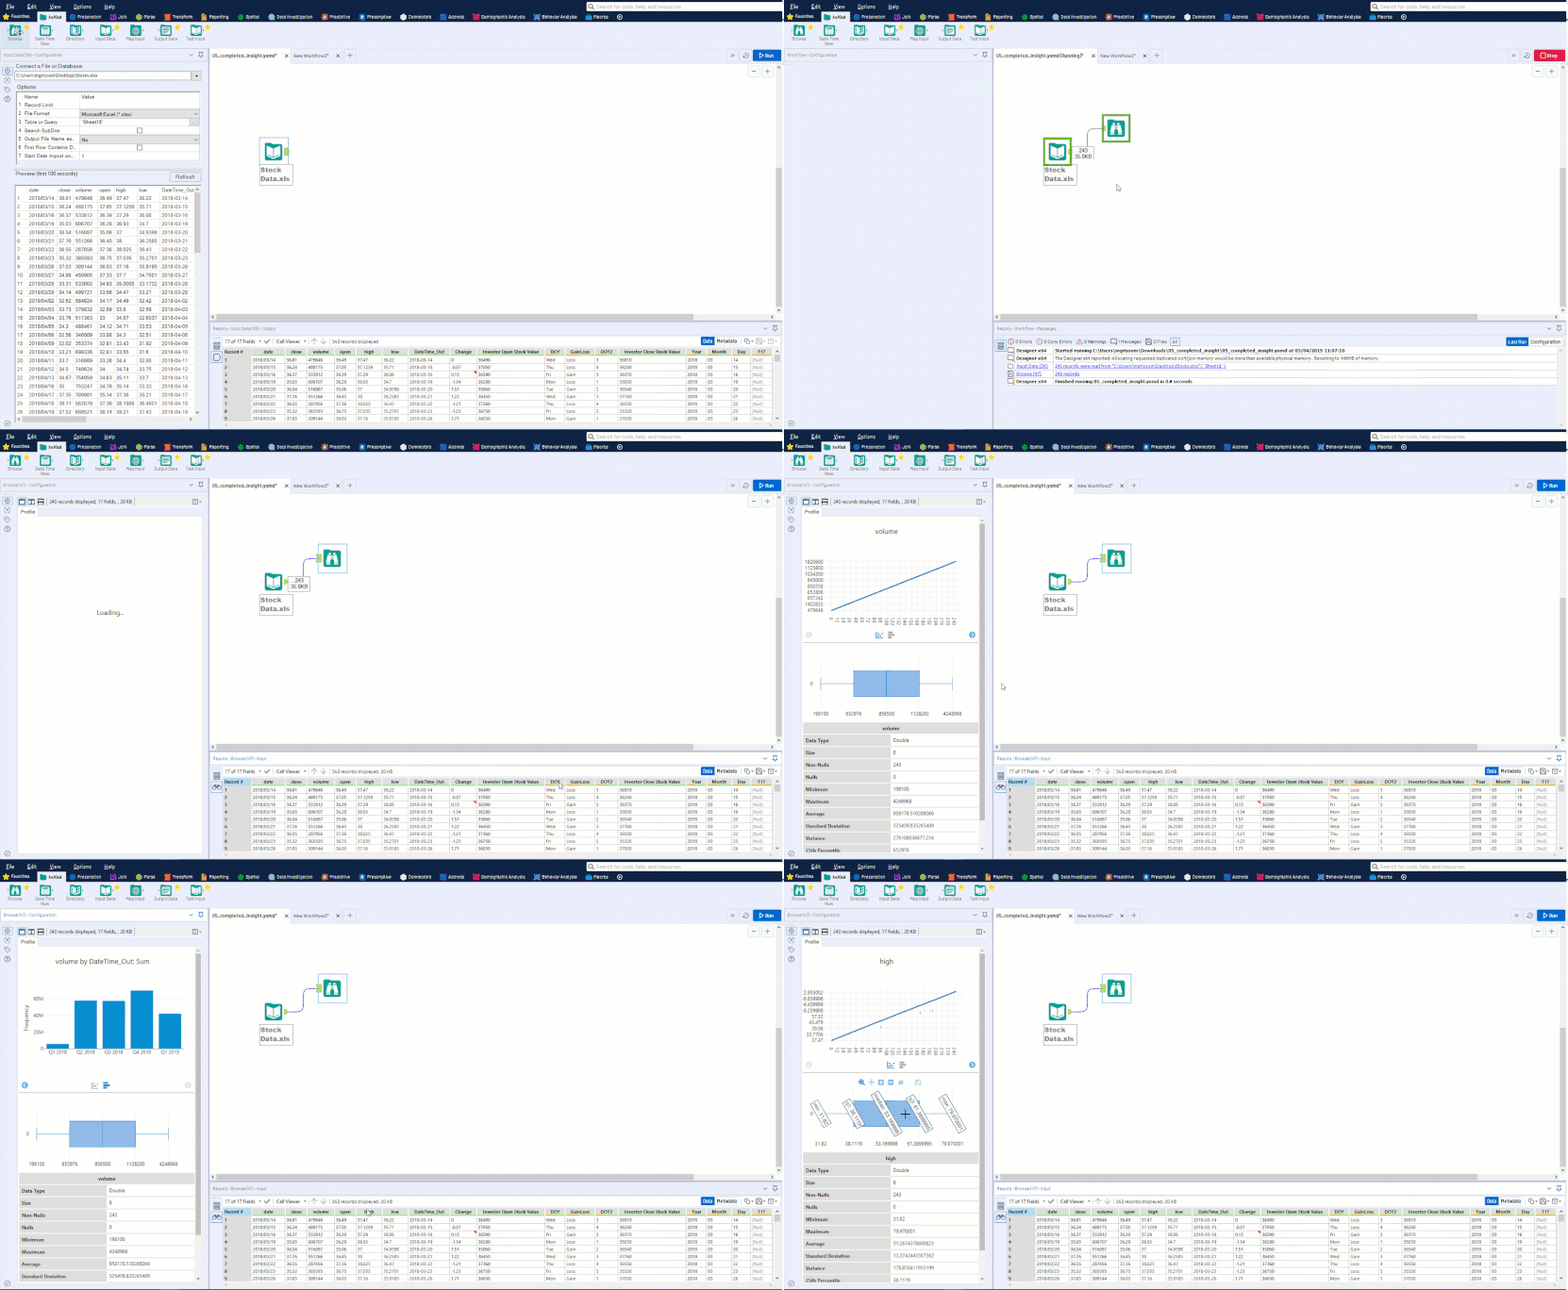
To SEE with Visualytics, simply drag and drop a browse tool at any point in your analysis, run your workflow and click on different columns in the results grid to see the profile of your data in the configuration panel.
 SEE: Visual data profiling
SHARE
You've put a lot of work into getting your answers, but now what do you do with them? Often, we want to share our answers in an email, presentation or report of some type. How you communicate your results matters. Let’s take a look at two ways you might communicate the same result:
Option 1: It was a volatile 3rd quarter for your investment with a total gain of 3.98%
Option 2:
 SHARE: Q3 volatile investment
Although both options convey the same message, Option 2 communicates more of the story of the volatile third quarter to your audience.
As humans, we remember stories, not statistics. Research shows that we retain 65% of information when it is accompanied by an image, versus a mere 10% of information without an image (1).
 You’re likely to remember that thanks to this popular meme baby
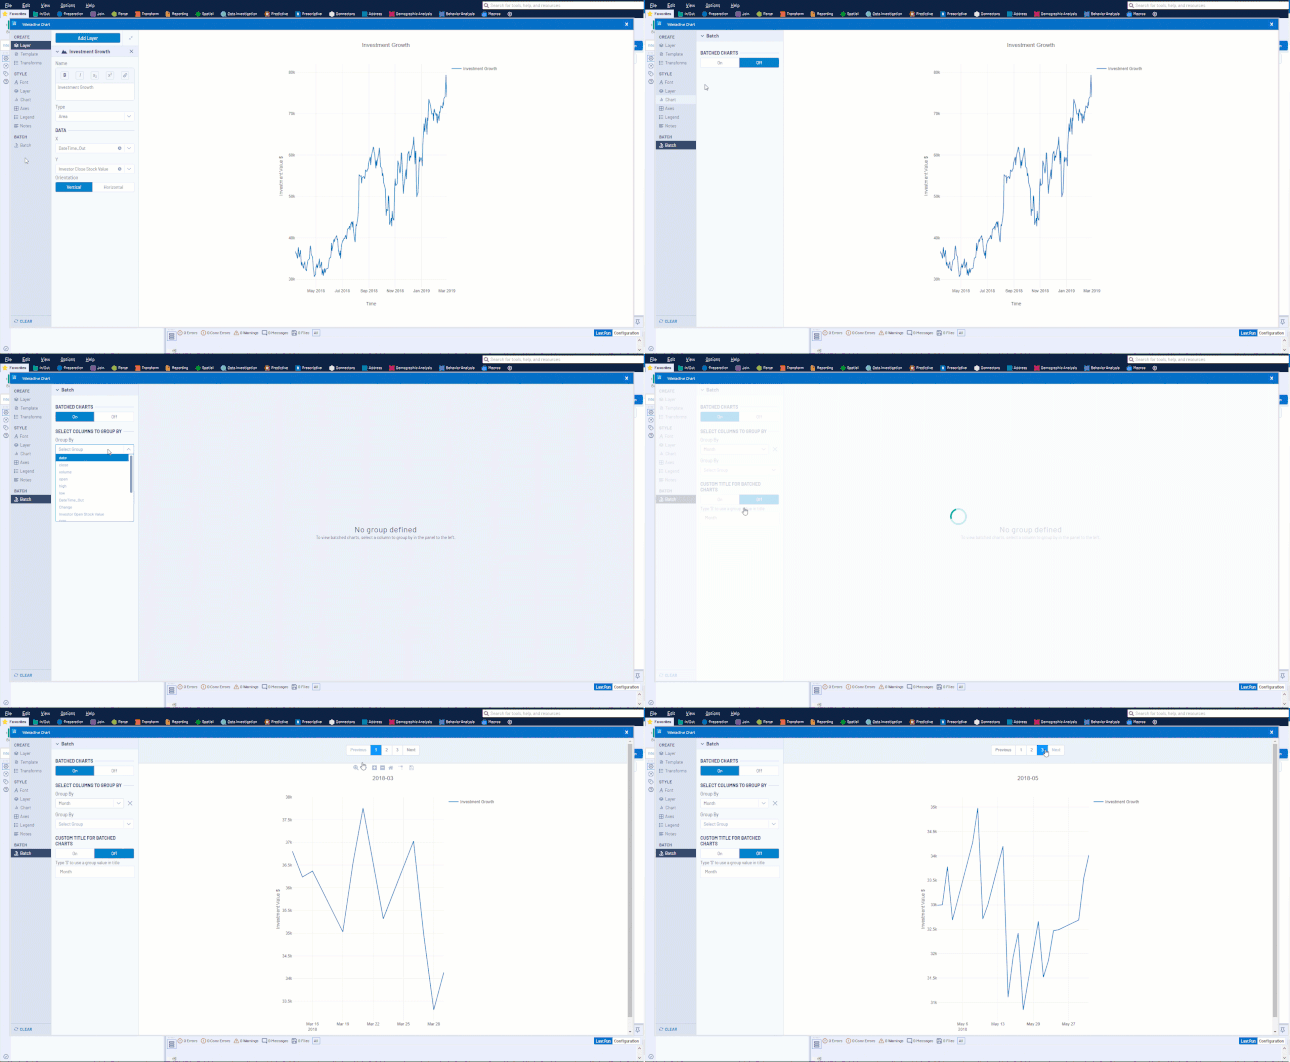
With Visualytics, you can quickly create and customize charts to bring answers to life, both ad hoc and in batches (e.g. for different regions, categories, etc.) With chart batching we can turn one chart into thousands with a click of a button. What is this chart batching magic? Well, the example below shows that you can create a chart and then split that chart by month so that exact chart with all of the formats now becomes dozens of charts that you can share.
Once we’ve performed our magic and created an abundance of pixel perfect charts, we can send them off in different formats such PowerPoint, pdf, of .png with just a few clicks. While we’re at it, let’s go ahead and put it on auto-pilot so those reports are updated and sent without having to lift a finger.
“Using Alteryx, Jay was able to collate and summarize historical [Coca-Cola] data and automatically generate and send over 600 personalized reports to restaurant owners… ‘I can’t imagine doing my job without Alteryx,’ Jay insists. ‘Nor would I want to,’ he adds with a smile.” (Read the case study)
One of the most popular ways to SHARE with Visualytics is through the Interactive Chart tool. Simply drag and drop an Interactive Chart Tool, run your workflow and configure. Add a layer, choose your chart type and start customizing the details or build stacked bar or bubble charts to communicate more complex information using the ‘Split By’ functionality.
For a step by step guide to creating your first chart, check out this blog post. Take your charts one step further and create customized reports that include maps, images, tables, text and charts to ensure your answers reach the right people in the right way.

INTERACT
Standard charts provide a wonderful snapshot of your story, but what happens when people want to explore more of your analysis?
With Visualytics, you empower stakeholders to explore your data and analysis for themselves. By tying charts together, you create a visual dashboard that anyone can drill down into. Stakeholders can interact with this dashboard, drill down into the data, use filters to focus on what's important to them and discover their own answers.
To INTERACT with Visualytics, drag and drop an Insight Tool, run your workflow and click configure. Drag a chart onto your dashboard, configure and customize. There are a few additional options in the Insight Tool, including drill down which creates the interactivity when someone double clicks on your chart to dive in deeper. Once you've created one chart, drag more onto the dashboard or add text and create filters.
For a step-by-step guide on creating your first dashboard, click here.
Visualytics is all about taking advantage of the way our brains work by combining analytics and visualizations into graphics that we can see, share, and interact with…and have a really fun time saying the word.
(1) https://www.techsmith.com/blog/why-visual-communication-matters/


