Alteryx Success Stories
Learn how Alteryx customers transform their organizations using data and analytics.- Community
- :
- Public Archive
- :
- Success Stories
- :
- Using Spatial Analytics for Retail Site Analysis
Using Spatial Analytics for Retail Site Analysis
- Subscribe to RSS Feed
- Mark as New
- Mark as Read
- Printer Friendly Page
Using Spatial Analytics for Retail Site Analysis
Author: Jason Claunch - President
Company: Catalyst
Business Partner: Slalom Consulting - Sean Hayward and; Marek Koenig
Originally Published: 2017 Excellence Awards Entry
Use Case Overview:
The developed solution used many of the Spatial Analytics components available within Alteryx:
- Trade Area – have user select target area to analyze
- Spatial Match – combine multiple geospatial objects,
- Intersection – cut objects from each other to create subject area
- Grid tool – sub-divide the trade blocks to determine complete coverage of trade ring
- Distance – use drivetime calculation to score and rank retailers in the vicinity
Describe the problem you needed to solve:
Retail site analysis is a key part of our business and was taking up too much time with repetitive tasks that could have been easily automated.
Describe the working solution:
To support selection of best-fit operators, Catalyst partnered with Slalom Consulting to develop a tool to identify potential uses to target for outreach and recruitment. Previously, we would have to manually build demographic profiles using tools like qGIS, ESRI, and others, but found the process to be cumbersome and quite repetitive. Demographic data was acquired at the trade bloc level, which was too granular for identify target locations and would not mesh well with the retail data.
Alteryx and its spatial capabilities was used in a few ways:
1) Minimize our retail data selection from the entire US to a selected state using the Spatial Match tool.
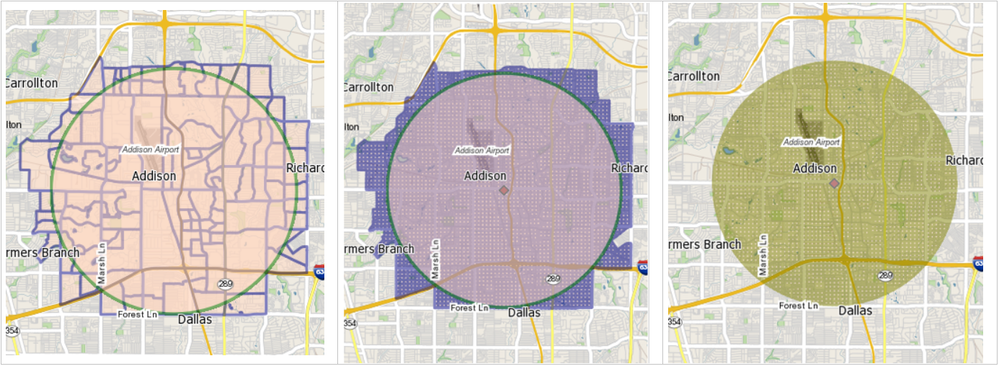
2) Create a demographic profile for each retail location that consisted of data points such as median income, population, daytime employees, and others. The data was aggregated around a 3 mile radius of the specific retail location with an Alteryx Macro composed of a Trade Area, Grid Tool, Spatial Match, and Summarization tool.
3) Using a Map Input, the user selected an area to profile and candidate retailers were output for further review.
4) After selecting specific retailers to do an in-depth analysis on, Alteryx would score all possible locations by distance (Drivetime Analysis) and by score (proprietary weighting of various demographic attributes). The profiled results were then used to build a client presentation; the automated profiling tool saved us countless hours and allowed us to deliver more detailed analysis for our clients.
Describe the benefits you have achieved:
Using Alteryx was a massive time saver, the tool that we built took a process that normally required at least 8 hours of manual work down to merely a few minutes. This has directly benefited our bottom line by allowing us to focus on more key tasks in our client outreach and recruitment. A return-on-investment was immediately realized after we were able to close a deal with a major client using our new process.
-
Adobe
2 -
Alteryx Connect
5 -
Alteryx Designer
202 -
Alteryx for Good
1 -
Alteryx Promote
2 -
Alteryx Server
66 -
Alteryx using Alteryx
29 -
Americas
158 -
Analyst
108 -
Analytics Leader
54 -
Asia Pacific
29 -
AWS
9 -
BI + Analytics + Data Science
100 -
Business Leader
37 -
C-Leader
18 -
Data Prep + Analytics
230 -
Data Science + Machine Learning
113 -
Data Scientist
14 -
Department: Other
14 -
Education
18 -
Energy + Utilities
5 -
Europe + Middle East + Africa
58 -
Experian
2 -
finance
29 -
Financial Services
33 -
Healthcare + Insurance
21 -
Human Resources
19 -
Information Technology
25 -
IT
31 -
Life Sciences + Pharmaceuticals
3 -
Manufacturing
20 -
Marketing
16 -
Media + Entertainment
12 -
Microsoft
52 -
Operations
38 -
Other
10 -
Process Automation
60 -
Professional Services
69 -
Public Sector
15 -
Qlik
1 -
Retail + CPG
32 -
Sales and Service
24 -
Salesforce
9 -
SAP
11 -
Snowflake
6 -
Tableau
71 -
Tech Partner: Other
86 -
Technology
34 -
Telecommunications
5 -
Teradata
5 -
Thomson Reuters
1 -
Transportation + Logistics
25 -
Travel + Hospitality
4 -
UiPath
1
- « Previous
- Next »


