Alteryx Designer Desktop Discussions
Find answers, ask questions, and share expertise about Alteryx Designer Desktop and Intelligence Suite.- Community
- :
- Community
- :
- Participate
- :
- Discussions
- :
- Designer Desktop
- :
- K-centroids cluster analysis
K-centroids cluster analysis
- Subscribe to RSS Feed
- Mark Topic as New
- Mark Topic as Read
- Float this Topic for Current User
- Bookmark
- Subscribe
- Mute
- Printer Friendly Page
- Mark as New
- Bookmark
- Subscribe
- Mute
- Subscribe to RSS Feed
- Permalink
- Notify Moderator
Dear Community,
I have HR data, where I have to create different segments of employees to study each one and determine its financial effect on the organization.
I'm trying to create a k-means clustering, but I have the following concerns & issues:
- I am building the model using 3 numerical variables (employee_age, avg_monthly_salary, months_of_service), I'm not sure if these variables could be used to create the clusters or not.
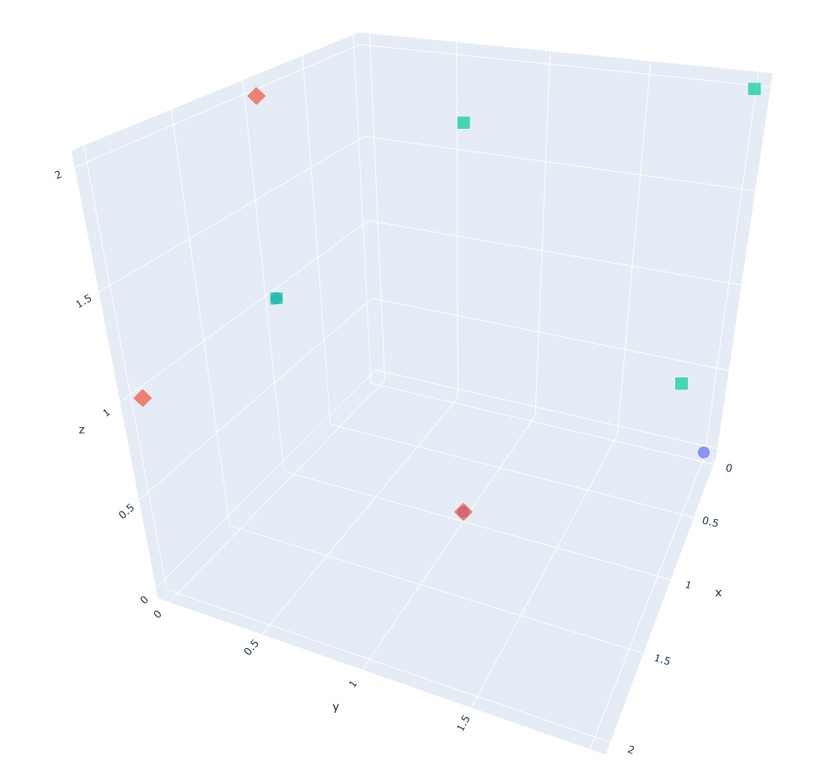
- What is the ideal way to visualize these clusters together so I can notice and compare if the clusters are really unique or they are overlapping, the below screenshot shows a sample of what I need:
I'm ok with using python or alteryx, so kindly any reference, comment, or note would be highly valuable.
Thank you,,
Solved! Go to Solution.
- Mark as New
- Bookmark
- Subscribe
- Mute
- Subscribe to RSS Feed
- Permalink
- Notify Moderator
- Mark as New
- Bookmark
- Subscribe
- Mute
- Subscribe to RSS Feed
- Permalink
- Notify Moderator
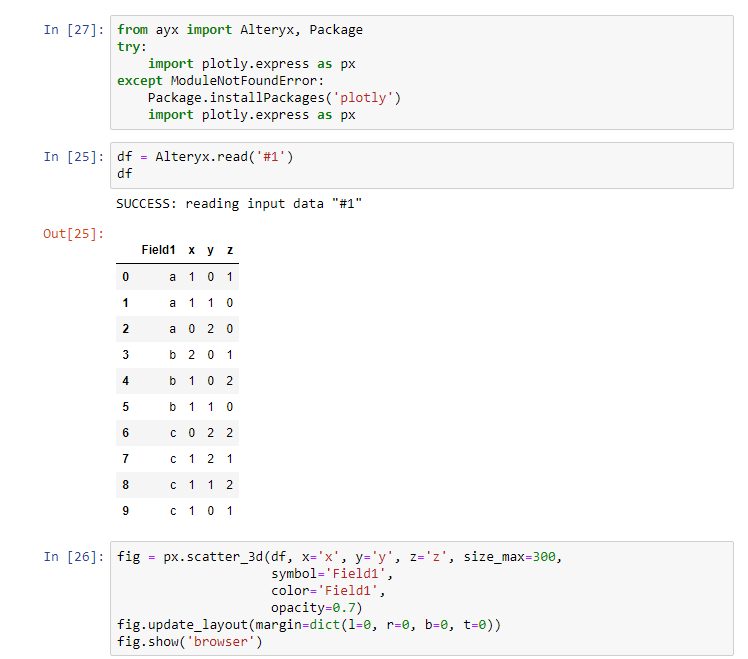
Documentation for this can be found here: https://plotly.com/python/3d-scatter-plots/
- Mark as New
- Bookmark
- Subscribe
- Mute
- Subscribe to RSS Feed
- Permalink
- Notify Moderator
Many thanks, will try it
- Mark as New
- Bookmark
- Subscribe
- Mute
- Subscribe to RSS Feed
- Permalink
- Notify Moderator
Hi @refmd
As a leader in the Alteryx Community, I have the ability to identify & mark accepted solutions on behalf of community members - and recently did so on this thread. If you have any questions or concerns with the solution(s) I selected please let me know by replying to this post.
Learn more about Accepted Solutions here.
Happy Alteryx-ing!
-
Academy
6 -
ADAPT
2 -
Adobe
204 -
Advent of Code
3 -
Alias Manager
78 -
Alteryx Copilot
26 -
Alteryx Designer
7 -
Alteryx Editions
95 -
Alteryx Practice
20 -
Amazon S3
149 -
AMP Engine
252 -
Announcement
1 -
API
1,209 -
App Builder
116 -
Apps
1,360 -
Assets | Wealth Management
1 -
Basic Creator
15 -
Batch Macro
1,559 -
Behavior Analysis
246 -
Best Practices
2,695 -
Bug
719 -
Bugs & Issues
1 -
Calgary
67 -
CASS
53 -
Chained App
268 -
Common Use Cases
3,825 -
Community
26 -
Computer Vision
86 -
Connectors
1,426 -
Conversation Starter
3 -
COVID-19
1 -
Custom Formula Function
1 -
Custom Tools
1,939 -
Data
1 -
Data Challenge
10 -
Data Investigation
3,488 -
Data Science
3 -
Database Connection
2,221 -
Datasets
5,223 -
Date Time
3,229 -
Demographic Analysis
186 -
Designer Cloud
743 -
Developer
4,376 -
Developer Tools
3,533 -
Documentation
528 -
Download
1,037 -
Dynamic Processing
2,941 -
Email
928 -
Engine
145 -
Enterprise (Edition)
1 -
Error Message
2,262 -
Events
198 -
Expression
1,868 -
Financial Services
1 -
Full Creator
2 -
Fun
2 -
Fuzzy Match
714 -
Gallery
666 -
GenAI Tools
3 -
General
2 -
Google Analytics
155 -
Help
4,711 -
In Database
966 -
Input
4,296 -
Installation
361 -
Interface Tools
1,902 -
Iterative Macro
1,095 -
Join
1,960 -
Licensing
252 -
Location Optimizer
60 -
Machine Learning
260 -
Macros
2,865 -
Marketo
12 -
Marketplace
23 -
MongoDB
82 -
Off-Topic
5 -
Optimization
751 -
Output
5,258 -
Parse
2,328 -
Power BI
228 -
Predictive Analysis
937 -
Preparation
5,171 -
Prescriptive Analytics
206 -
Professional (Edition)
4 -
Publish
257 -
Python
855 -
Qlik
39 -
Question
1 -
Questions
2 -
R Tool
476 -
Regex
2,339 -
Reporting
2,434 -
Resource
1 -
Run Command
575 -
Salesforce
277 -
Scheduler
411 -
Search Feedback
3 -
Server
631 -
Settings
936 -
Setup & Configuration
3 -
Sharepoint
628 -
Spatial Analysis
599 -
Starter (Edition)
1 -
Tableau
512 -
Tax & Audit
1 -
Text Mining
468 -
Thursday Thought
4 -
Time Series
432 -
Tips and Tricks
4,187 -
Topic of Interest
1,126 -
Transformation
3,731 -
Twitter
23 -
Udacity
84 -
Updates
1 -
Viewer
3 -
Workflow
9,982
- « Previous
- Next »


