Weekly Challenges
Solve the challenge, share your solution and summit the ranks of our Community!Also available in | Français | Português | Español | 日本語
IDEAS WANTED
Want to get involved? We're always looking for ideas and content for Weekly Challenges.
SUBMIT YOUR IDEA- Community
- :
- Community
- :
- Learn
- :
- Academy
- :
- Challenges & Quests
- :
- Weekly Challenges
- :
- Re: Challenge #95: Draw 1000 Apples in Under 60 Se...
Challenge #95: Draw 1000 Apples in Under 60 Seconds
- Subscribe to RSS Feed
- Mark Topic as New
- Mark Topic as Read
- Float this Topic for Current User
- Bookmark
- Subscribe
- Mute
- Printer Friendly Page
- Mark as New
- Bookmark
- Subscribe
- Mute
- Subscribe to RSS Feed
- Permalink
- Notify Moderator
- Mark as New
- Bookmark
- Subscribe
- Mute
- Subscribe to RSS Feed
- Permalink
- Notify Moderator
- Mark as New
- Bookmark
- Subscribe
- Mute
- Subscribe to RSS Feed
- Permalink
- Notify Moderator
- Mark as New
- Bookmark
- Subscribe
- Mute
- Subscribe to RSS Feed
- Permalink
- Notify Moderator
- Mark as New
- Bookmark
- Subscribe
- Mute
- Subscribe to RSS Feed
- Permalink
- Notify Moderator
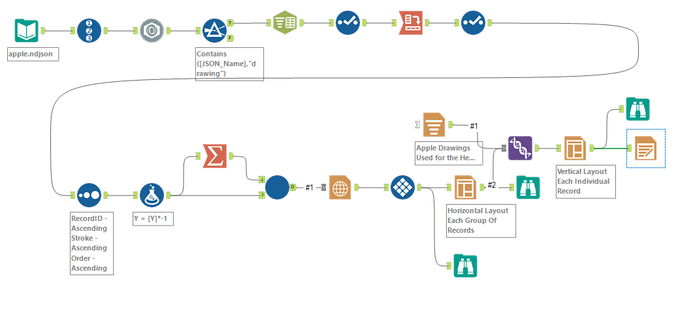
Had to do some digging to identify how to read in the information as a JSON with a little trick then was able to identify some coordinates, had help from community to multiply the Y values by -1, created some coordinate points, used a heat map, and some reporting tools and was able to get a pretty similar solution!
- Mark as New
- Bookmark
- Subscribe
- Mute
- Subscribe to RSS Feed
- Permalink
- Notify Moderator
- Mark as New
- Bookmark
- Subscribe
- Mute
- Subscribe to RSS Feed
- Permalink
- Notify Moderator
I ended up coming up with multiple ways to do this.
In one case I created a workflow for a single JSON row and ran it with a batch input.
In the other I processed everything at once.
Essentially, I learned that generating any kind of report requires a lot of "Layout" tools with a union and a render.
This is why we have people whose job it is to turn my analysis into reports, right?
- Mark as New
- Bookmark
- Subscribe
- Mute
- Subscribe to RSS Feed
- Permalink
- Notify Moderator
- Mark as New
- Bookmark
- Subscribe
- Mute
- Subscribe to RSS Feed
- Permalink
- Notify Moderator
Hard stuff here ........
- Mark as New
- Bookmark
- Subscribe
- Mute
- Subscribe to RSS Feed
- Permalink
- Notify Moderator
Really hard challenge, drawing the apple is quite tricky, though first time ever used heat map tool. The final reporting is really hard to line up.
-
Advanced
299 -
Apps
27 -
Basic
156 -
Calgary
1 -
Core
155 -
Data Analysis
186 -
Data Cleansing
6 -
Data Investigation
7 -
Data Parsing
15 -
Data Preparation
234 -
Developer
35 -
Difficult
85 -
Expert
16 -
Foundation
13 -
Interface
39 -
Intermediate
266 -
Join
211 -
Macros
61 -
Parse
141 -
Predictive
20 -
Predictive Analysis
14 -
Preparation
272 -
Reporting
55 -
Reporting and Visualization
17 -
Spatial
60 -
Spatial Analysis
53 -
Time Series
1 -
Transform
225
- « Previous
- Next »


