Alter.Nation
Community news, customer stories, and more!- Community
- :
- Community
- :
- Learn
- :
- Blogs
- :
- Alter.Nation
- :
- #SANTALYTICS Part 1: Solution and Behind the Data
- Subscribe to RSS Feed
- Mark as New
- Mark as Read
- Bookmark
- Subscribe
- Printer Friendly Page
- Notify Moderator
Solution
If you’re reading this blog post, then you probably participated in the first of four exercises that will constitute the Santalytics challenge - an inclusive, non-denominational, festive excuse for some friendly competition using Alteryx. It also means your spot on Santa’s nice list is secured AND you’re going to be both warm and stylin’ this winter season in your Alteryx swag. That is, if you’ve successfully been able to use Alteryx to improve the elves’ situation from last year:
We’ve gone ahead and attached a detailed solution for Santalytics Part 1 to this post (v10.6), but the highlights are below:
Classifying the presents is short work with the Tile Tool – just use the Equal Records method (20 tiles) and it’ll sort and bin for you. Be sure to change the price field to a numeric type first!
*the table shown above is a sampled view of the solution dataset
Classifying the kids into groups that’ll correspond to those present groups is a little more work:
- The naughty actions need to be subtracted from nice actions to find out how “naughty” vs “nice” each kid was. We used a little formula logic to make naughty actions negative in degree and summarized (sum), but there are other approaches.
- Once a score is calculated for reach Recipient ID, you can join each kid to their respective naughty/nice score and use the same Tile Tool approach (25 tiles, to account for naughty ratings) as the above.
- Santa, despite doing this for centuries, didn’t have all his naughty or nice classifications in an order than could be easily joined (or, err, read). While the exact naughty order doesn’t matter (they’re all getting coal), the nice classifications could have been reversed to make more sense for the increasing degrees of niceness (note: this isn’t necessarily required, as the classification text doesn’t affect the present distribution – only the order, which should have been determined by naughty/nice score). We did this with formula logic as well.
*the table shown above is a sampled view of the solution dataset
Once all the pieces above have been worked through you have naughty/nice ratings for each kid that correspond to their gift tier and exclude the last 5 groupings – the naughty kids. The wedgy giving, loogie hocking, terrors of the world. Of which, you should have taken special notice of Willie Carr, who can be safely presumed as the devil:
Willie Carr on Christmas morn
Big thanks to our #SANTALYTICS Part 1 participants @JohnJPS, @pcatterson, @patrick_digan, @zperkins, @nsmith04, @MichelKars, @cor, @CailinS, @Treyson (and team), @JordanB, @lminors, @MarqueeCrew, @tom_montpool, @jdunkerley79, @AlexKo, @JonA, @SophiaF, @Joe_Mako, @emilienl, @Philip, @AudreyL
Behind the Data
We hear the adage time and time again – an analysis is only as good as the data behind it. So how, then, did we get all of the festive data for the Santalytics series? Well, if you want to believe in the magic of Santa, the short answer is that his elves sent it all over to us and asked for help. If you want to believe in the magic of Alteryx, the long answer is below (spoilers!):

Good ‘ol fashion data wranglin’ of course.
The data stores we used came from a handful of unique sources/methods. They also required some processing to shape the raw datasets to a format we were comfortable staging the Santalytics questions around.
Admittedly, at first pass the process looked a lot more like the below:
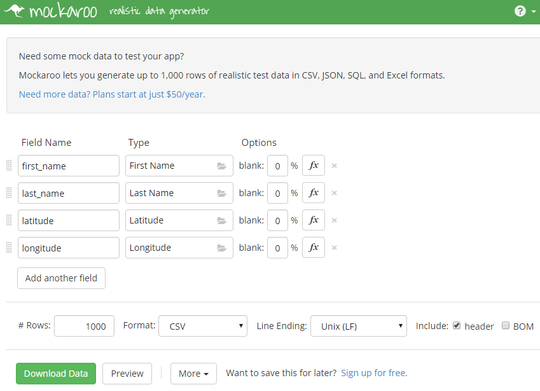
We quickly discovered wrangling data from scratch is no easy task for the uninitiated and we set out just like anyone without a clue - with baby steps. The first step was to make sure we could do a present delivery-type scenario by having a number of kids located across the globe. This would require spatial data in the form of coordinates or real addresses. Luckily, we found a tool just for that - the Mockaroo realistic data generator. Mockaroo made it extremely easy to specify fields for names and latitude/longitude pairs and randomly generate 1,000 data points at a time:
Knowing that spatial processing often ends up to be fairly computation-heavy, we only generated 16 batches of 1,000 and filtered to 15,000 data points that were confirmed to geocode. Once we had our spatial data for locating the kids accounted for, it was time to figure out if these kids were naughty or nice.
This led us to one of the finer gems of the holiday season: the Claus.com Nice-o-meter. If you’re unfamiliar with the Nice-o-meter, it’s the scientific measure of who’s naughty or nice based on their first and last names - and it is measured to 100% accuracy:
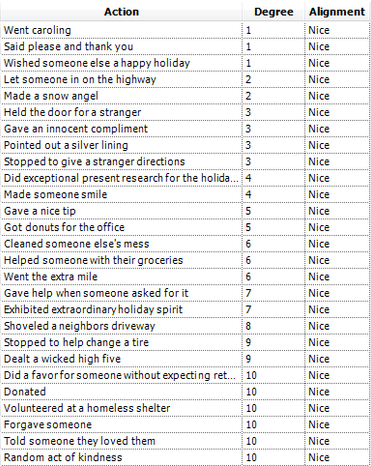
Using the infallible Nice-o-meter and other naughty/nice calculators on the web, we determined a handful of classifications for naughty or nice kids. We then created naughty or nice actions to fit the kids to those classifications by hand:
Once the classifications and actions were identified, we only needed to decide what kids did which actions throughout the course of the year. We figured the best way to do so would be to create 12 months worth of action logs that resembled transactional data in formatting. This was made easy with the Generate Rows Tool (to create month and day records) and the RandInt() function (to randomly assign a number of actions to a day, as well as the specific action). The workflow that built the action logs is visualized below:
Last but not least, we had to determine presents that would be awarded to the nice kids. After considering a number of different APIs and flat file data stores, we chose the BestBuy Products API because it included accurate product shipping weights and had relative ease of access. Using their Products Bulk Download option and our Download Tool, we established an API connection (coding approach) to sweep 57,000 physical products (after parsing) to be filtered down for distribution to the nicest kids this year:
With our product data, spatial data, and naughty/nice actions and rankings determined we were ready to proceed with the gauntlet of Santalytics challenges. And with that, we’re happy to announce week 2 of the challenge. Help Santa out again this week to secure your spot on the nice list!
Ready for Part 2?
We're just getting started. We told you this was a 4-part series. Let's determine some trade areas for Santa. You'll have to be pretty spatial, -er- clever to solve this one.
Part 2 is now live. Be sure to use the data from the Part 1 solution attached below!

Data Engineer
Former Alteryx, Inc. Support Engineer, Community Data Architect, Data Scientist then Data Engineer. Starting from the old data warehousing paradigm in big pharma, Matt found Alteryx on the first day of the rest of his life. Matt has a MS in Biomedical Engineering & Bioinformatics and is passionate about all things integrated data management and analytics. The Alteryx analytics badassery journey continues here! https://community.alteryx.com/t5/user/viewprofilepage/user-id/375130
Former Alteryx, Inc. Support Engineer, Community Data Architect, Data Scientist then Data Engineer. Starting from the old data warehousing paradigm in big pharma, Matt found Alteryx on the first day of the rest of his life. Matt has a MS in Biomedical Engineering & Bioinformatics and is passionate about all things integrated data management and analytics. The Alteryx analytics badassery journey continues here! https://community.alteryx.com/t5/user/viewprofilepage/user-id/375130
You must be a registered user to add a comment. If you've already registered, sign in. Otherwise, register and sign in.


