Weekly Challenges
Solve the challenge, share your solution and summit the ranks of our Community!Also available in | Français | Português | Español | 日本語
IDEAS WANTED
Want to get involved? We're always looking for ideas and content for Weekly Challenges.
SUBMIT YOUR IDEA- Community
- :
- Community
- :
- Learn
- :
- Academy
- :
- Challenges & Quests
- :
- Weekly Challenges
- :
- Re: Challenge #90: Analyzing Social Data (Part 2...
Challenge #90: Analyzing Social Data (Part 2)
- Subscribe to RSS Feed
- Mark Topic as New
- Mark Topic as Read
- Float this Topic for Current User
- Bookmark
- Subscribe
- Mute
- Printer Friendly Page
- Mark as New
- Bookmark
- Subscribe
- Mute
- Subscribe to RSS Feed
- Permalink
- Notify Moderator
Most tweet is from the Tweet user that have from 180 to1500 users.
it show that this activities had successfully bring up the trend. As less followers mean more close to citizens.
- Mark as New
- Bookmark
- Subscribe
- Mute
- Subscribe to RSS Feed
- Permalink
- Notify Moderator
- Mark as New
- Bookmark
- Subscribe
- Mute
- Subscribe to RSS Feed
- Permalink
- Notify Moderator
- Mark as New
- Bookmark
- Subscribe
- Mute
- Subscribe to RSS Feed
- Permalink
- Notify Moderator
Fun with word clouds! (Not much actual analysis but it was fun to create)
- Mark as New
- Bookmark
- Subscribe
- Mute
- Subscribe to RSS Feed
- Permalink
- Notify Moderator
Here is my dashboard and I've also attached the workflow from the last challenge.
- Mark as New
- Bookmark
- Subscribe
- Mute
- Subscribe to RSS Feed
- Permalink
- Notify Moderator
Here is my solution!


Cheers!
Phil
- Mark as New
- Bookmark
- Subscribe
- Mute
- Subscribe to RSS Feed
- Permalink
- Notify Moderator
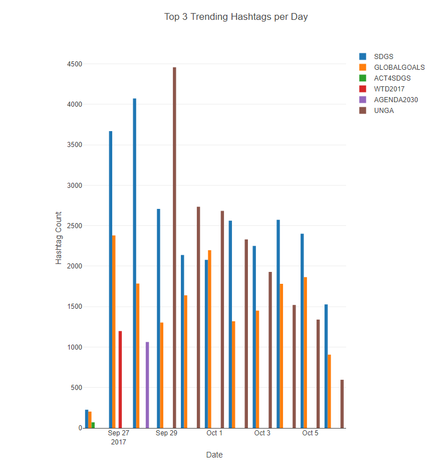
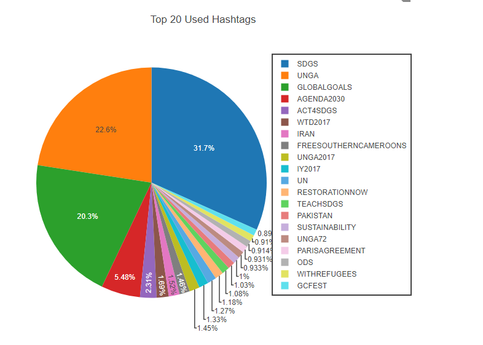
I used Tableau to gain insights surrounding tweets, hashtags, and followers categories. Most tweets occurred on the evening of 9/28 whereas the peak retweets then occurred on 9/29 of 2017. Additionally, the most original tweets came from the user Adam Rogers and the most retweets were from SDGs tweet which also used the SDGs hashtag. SDGs was in fact the most used hashtag with UNGA and GlobalGoals following shortly after. SDGs was consistently used over the 11 day period, but UNGA had the highest peak noon and then 4pm on 9/29/2017. Finally, GlobalGoals was the hashtag with the most follwers, but that mainly is because the United Nations used this hashtag and they have 133 million followers. Finally, SDGs, UNGA, and GlobalGoals had the highest follower count, but although UNGA had the highest follower count on 9/29 at 39 million, UNGA and SDGs slowly lost followers, wheras GlobalGoals had an increase with the most still by the end of the 11 day period.
- Mark as New
- Bookmark
- Subscribe
- Mute
- Subscribe to RSS Feed
- Permalink
- Notify Moderator
Threw together a quick viz in Tableau for this one. Definitely not my best dashboard ever, but it works in a pinch (and does use dynamic filtering in the actual viz).
- Mark as New
- Bookmark
- Subscribe
- Mute
- Subscribe to RSS Feed
- Permalink
- Notify Moderator
- Mark as New
- Bookmark
- Subscribe
- Mute
- Subscribe to RSS Feed
- Permalink
- Notify Moderator
-
Advanced
302 -
Apps
27 -
Basic
158 -
Calgary
1 -
Core
157 -
Data Analysis
185 -
Data Cleansing
5 -
Data Investigation
7 -
Data Parsing
14 -
Data Preparation
238 -
Developer
36 -
Difficult
87 -
Expert
16 -
Foundation
13 -
Interface
39 -
Intermediate
268 -
Join
211 -
Macros
62 -
Parse
141 -
Predictive
20 -
Predictive Analysis
14 -
Preparation
272 -
Reporting
55 -
Reporting and Visualization
16 -
Spatial
60 -
Spatial Analysis
52 -
Time Series
1 -
Transform
227
- « Previous
- Next »


