Weekly Challenges
Solve the challenge, share your solution and summit the ranks of our Community!Also available in | Français | Português | Español | 日本語
IDEAS WANTED
Want to get involved? We're always looking for ideas and content for Weekly Challenges.
SUBMIT YOUR IDEA- Community
- :
- Community
- :
- Learn
- :
- Academy
- :
- Challenges & Quests
- :
- Weekly Challenges
- :
- Challenge #50: Preparing Survey Data
Challenge #50: Preparing Survey Data
- Subscribe to RSS Feed
- Mark Topic as New
- Mark Topic as Read
- Float this Topic for Current User
- Bookmark
- Subscribe
- Mute
- Printer Friendly Page
- Mark as New
- Bookmark
- Subscribe
- Mute
- Subscribe to RSS Feed
- Permalink
- Notify Moderator
The link to last week’s challenge is HERE.
Happy thanksgiving to the USA based challenge participants, hopefully you are hungry for another exercise. This week we will continue with some more data parsing and preparation with survey data. Enjoy!
Use Case: The 2 sources of data contain survey information. The Data input contains all of the survey responses. The Questions input contains the associated questions.
The column (called Column) in the Questions file corresponds to the field header value in the Data file, so value 38 in the Questions files is the questions associated with field F38 in the Data file.
The first row in the Data file contains the response type. In field F38, the data is formatted as Response (Scale 1-10) - Age Range.
Objective: Create an output file for a visualization tool (Tableau, Qlik, PowerBI) that details the response by age for each individual.
- Mark as New
- Bookmark
- Subscribe
- Mute
- Subscribe to RSS Feed
- Permalink
- Notify Moderator
If you need some hints on how survey data would be used in a a tool like Tableau, I highly recommend checking out Steve Wexler's blog- he's written extensively about dealing with and visualizng survey data:
http://www.datarevelations.com/category/visualizing-survey-data-and-likert-scales
- Mark as New
- Bookmark
- Subscribe
- Mute
- Subscribe to RSS Feed
- Permalink
- Notify Moderator
- Mark as New
- Bookmark
- Subscribe
- Mute
- Subscribe to RSS Feed
- Permalink
- Notify Moderator
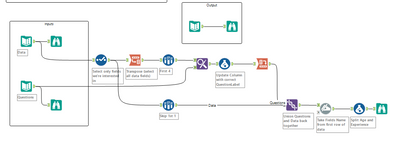
I added two additional Text Inputs, one for identifying question kinds (Single Choice, Multi-Choice, Linkert, etc) along with Question to Open Ended pairings also denotes if the Linkert scale is reversed, and one for identifying fields to become filterable Dimensions in Tableau.
The "Column" values in the "Questions" Input did not mact the actual field order in the "Data" Input. A Formula tool with the expression:
"F"+ToString(IF [Column]<89 THEN [Column]+10 ELSE [Column]-85 ENDIF)
this corrects the "Column" value.
The workflow adds RecordID to the "Data" Input, Transposes to make the data tall, Filters on RecordID=1 to Join back in the Label, uses Join Multiple to bring in attributes of the questions, then to parse the Response filters out the question kinds that need parsing, and additionally splits out the ID/Values for the multi-choice responses with multiple selections making use of the Join by record position to bring back together, Unions all the responses back together, pulls out the fields to be made into Dimensions with a Join tool, and Cross Tabs to create the additional fields, then Join Multiple to bring the data back in, and Outputs to a .tde file.

Since we cannot currently attach workflows, here is a link to it:
https://dl.dropboxusercontent.com/u/72203/Weekly%20Exercise/Week%2051%20Data_Prep_SurveyParsing.yxmd
Here is the published Tableau workbook, with some basic views of the different styles of questions:
https://public.tableau.com/profile/publish/Week51_0/LinkertSytleQuestions
- Mark as New
- Bookmark
- Subscribe
- Mute
- Subscribe to RSS Feed
- Permalink
- Notify Moderator
- Mark as New
- Bookmark
- Subscribe
- Mute
- Subscribe to RSS Feed
- Permalink
- Notify Moderator
good challenge
Other than that - very similar to posted solution
- Mark as New
- Bookmark
- Subscribe
- Mute
- Subscribe to RSS Feed
- Permalink
- Notify Moderator
- Mark as New
- Bookmark
- Subscribe
- Mute
- Subscribe to RSS Feed
- Permalink
- Notify Moderator
- Mark as New
- Bookmark
- Subscribe
- Mute
- Subscribe to RSS Feed
- Permalink
- Notify Moderator
@JoeM - this looks like it is going to be an epic sprint to be first to cross the 75 Mark. Do you think we can get live coverage of this on some Extreme Sports show? Just 7 more weeks to go, if my brain is working right....
- Mark as New
- Bookmark
- Subscribe
- Mute
- Subscribe to RSS Feed
- Permalink
- Notify Moderator
@SeanAdams, I'll submit a request for a live feed for Challenge #75 to be broadcast on ESPN 8 - "The Ocho". :)
-
Advanced
302 -
Apps
27 -
Basic
158 -
Calgary
1 -
Core
157 -
Data Analysis
185 -
Data Cleansing
5 -
Data Investigation
7 -
Data Parsing
14 -
Data Preparation
238 -
Developer
36 -
Difficult
87 -
Expert
16 -
Foundation
13 -
Interface
39 -
Intermediate
268 -
Join
211 -
Macros
62 -
Parse
141 -
Predictive
20 -
Predictive Analysis
14 -
Preparation
272 -
Reporting
55 -
Reporting and Visualization
16 -
Spatial
60 -
Spatial Analysis
52 -
Time Series
1 -
Transform
227
- « Previous
- Next »


