Weekly Challenges
Solve the challenge, share your solution and summit the ranks of our Community!Also available in | Français | Português | Español | 日本語
IDEAS WANTED
Want to get involved? We're always looking for ideas and content for Weekly Challenges.
SUBMIT YOUR IDEA- Community
- :
- Community
- :
- Learn
- :
- Academy
- :
- Challenges & Quests
- :
- Weekly Challenges
- :
- Re: Challenge #333: Remote or Not Remote
Challenge #333: Remote or Not Remote
- Subscribe to RSS Feed
- Mark Topic as New
- Mark Topic as Read
- Float this Topic for Current User
- Bookmark
- Subscribe
- Mute
- Printer Friendly Page
- Mark as New
- Bookmark
- Subscribe
- Mute
- Subscribe to RSS Feed
- Permalink
- Notify Moderator
A solution to last week’s challenge can be found here.
For this challenge, imagine you are a senior-level professional researching the job market.
The first dataset contains information about the job market in data analysis. The second dataset contains the country codes and the full names of the countries.
The experience is categorized into 4 levels:
- EN: Entry-level/Junior
- MI: Mid-level/Intermediate
- SE: Senior-level/Expert
- EX: Executive-level/Director
Remote ratio correspondence:
- If Remote_ratio = 0, the job is onsite.
- If Remote_ratio = 50, the job is hybrid.
- If Remote_ratio = 100, the job is remote.
Question 1
Taking into consideration the average salary, find the 5 best opportunities for a senior-level professional working full-time, 100% remote, and the countries where these opportunities can be found.
Only consider job titles that appear more than once and salary in USD.
Question 2
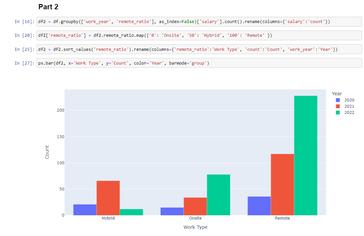
How do the remote, hybrid, and onsite ratios vary from 2020 to 2022? Build a graph to show your results.
Hints
- Append the country name in the dataset using the company_location_country_code field.
- Change your data types accordingly.
- Mark as New
- Bookmark
- Subscribe
- Mute
- Subscribe to RSS Feed
- Permalink
- Notify Moderator
It's 100% Remote here at Aimpoint Digital. Solution attached,
Adding my solution in the Python Tool,


from ayx import Alteryx
import plotly.express as px


#################################
df = Alteryx.read('#1')
country_mapper = Alteryx.read('#2')


#################################
job_count_mask = df.groupby('job_title')['job_title'].transform('count') > 1
df1 = df[job_count_mask]


#################################
mask = (df1.employment_type=='FT') & (df1.remote_ratio=='100') & (df1.experience_level=='SE')
df1 = df1[mask]


#################################
df1 = df1.join(country_mapper.set_index('country_code'), on='company_location_country_code')


#################################
df1['salary_in_usd'] = df1.salary_in_usd.astype(int)


#################################
df1.groupby(['country_name', 'job_title'], as_index=False)['salary_in_usd'].mean().nlargest(5, 'salary_in_usd')


#################################
df2 = df.groupby(['work_year', 'remote_ratio'], as_index=False)['salary'].count().rename(columns={'salary':'count'})


#################################
df2['remote_ratio'] = df2.remote_ratio.map({'0': 'Onsite', '50': 'Hybrid', '100': 'Remote' })


#################################
df2 = df2.sort_values('remote_ratio').rename(columns={'remote_ratio':'Work Type', 'count':'Count', 'work_year':'Year'})


#################################
px.bar(df2, x='Work Type', y='Count', color='Year', barmode='group')
- Mark as New
- Bookmark
- Subscribe
- Mute
- Subscribe to RSS Feed
- Permalink
- Notify Moderator
Challenge 333

- Mark as New
- Bookmark
- Subscribe
- Mute
- Subscribe to RSS Feed
- Permalink
- Notify Moderator
A couple of little pitfalls with that one, be careful to read the question!
Cheers,
TheOC!
- Mark as New
- Bookmark
- Subscribe
- Mute
- Subscribe to RSS Feed
- Permalink
- Notify Moderator
Nice challenge:
- Mark as New
- Bookmark
- Subscribe
- Mute
- Subscribe to RSS Feed
- Permalink
- Notify Moderator
- Mark as New
- Bookmark
- Subscribe
- Mute
- Subscribe to RSS Feed
- Permalink
- Notify Moderator
Like @PhilipMannering said, we are 100% remote at Aimpoint Digital 😊
- Mark as New
- Bookmark
- Subscribe
- Mute
- Subscribe to RSS Feed
- Permalink
- Notify Moderator
- Mark as New
- Bookmark
- Subscribe
- Mute
- Subscribe to RSS Feed
- Permalink
- Notify Moderator
- Mark as New
- Bookmark
- Subscribe
- Mute
- Subscribe to RSS Feed
- Permalink
- Notify Moderator
I had to do some debugging because I wasn't getting the right answer at first. I left my debugging steps in so that you can see where I made an adjustment.
-
Advanced
302 -
Apps
27 -
Basic
158 -
Calgary
1 -
Core
157 -
Data Analysis
185 -
Data Cleansing
5 -
Data Investigation
7 -
Data Parsing
14 -
Data Preparation
238 -
Developer
36 -
Difficult
87 -
Expert
16 -
Foundation
13 -
Interface
39 -
Intermediate
268 -
Join
211 -
Macros
62 -
Parse
141 -
Predictive
20 -
Predictive Analysis
14 -
Preparation
272 -
Reporting
55 -
Reporting and Visualization
16 -
Spatial
60 -
Spatial Analysis
52 -
Time Series
1 -
Transform
227
- « Previous
- Next »


