Weekly Challenges
Solve the challenge, share your solution and summit the ranks of our Community!Also available in | Français | Português | Español | 日本語
IDEAS WANTED
Want to get involved? We're always looking for ideas and content for Weekly Challenges.
SUBMIT YOUR IDEA- Community
- :
- Community
- :
- Learn
- :
- Academy
- :
- Challenges & Quests
- :
- Weekly Challenges
- :
- Challenge #269: Population DenCities
Challenge #269: Population DenCities
- Subscribe to RSS Feed
- Mark Topic as New
- Mark Topic as Read
- Float this Topic for Current User
- Bookmark
- Subscribe
- Mute
- Printer Friendly Page
- Mark as New
- Bookmark
- Subscribe
- Mute
- Subscribe to RSS Feed
- Permalink
- Notify Moderator
A solution to last week's challenge can be found here.
This week's challenge was submitted by @BeginnerMindset - Thank you for your submission!
When we’re building spatial models or performing geospatial analysis, we often need to work with centroids; in general terms, this can be defined as the centre of mass for the polygon assuming uniform density. In other words, it’s just “a dot in the middle” of whatever unit of geography we are using. However, it is usually important that we use a population-weighted centroid, which might be quite different. We’re also interested in the demographics (eg. age, life-stage, affluence) - we want to know “who lives where” and ultimately “where do our target customers live?”
This is a three part challenge:
1. Map the (unweighted) centroids of each country in the UK (Beginner)
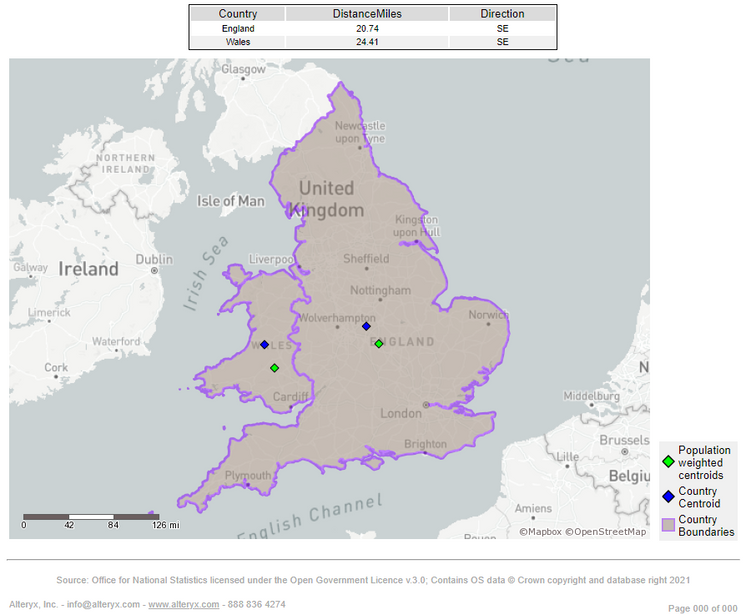
2. Map the population-weighted centroids for England and Wales. How far away are they from the unweighted centroids (in miles) and which cardinal direction? (Intermediate)
3. Investigate how the Over 65s are spread across England and Wales. (Advanced)
a) First calculate the percent of Over 65s within each Local Authority (LA).
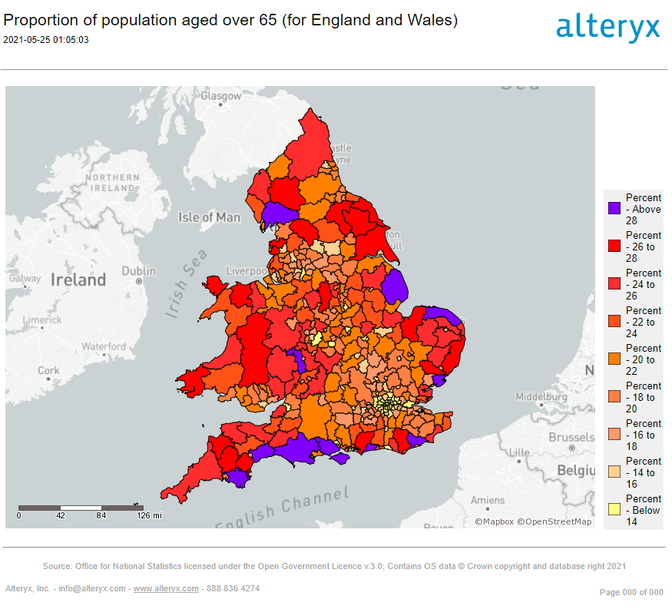
b) Create a thematic map to pick out the patterns. Modify the settings (colours, bands, borders) to paint a clearer picture. Include a title and a footer for the ONS copyrights.
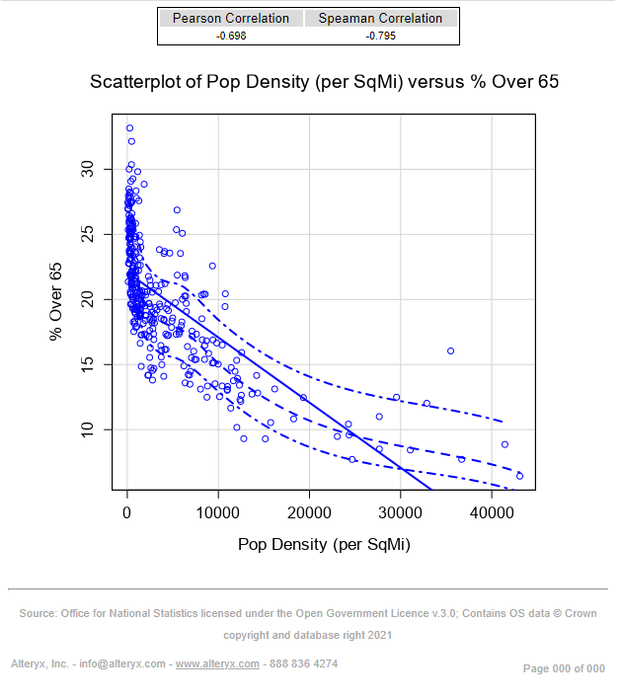
c) How does the proportion of Over 65s correlate with population density. Create a scatterplot and calculate the Pearson and Spearman correlations. Is there a strong relationship? Is it linear?
Note: all the data is from the ONS (Office for National Statistics) and is released under the terms of an Open Government License, so it is vital to include any relevant copyright statements if reproducing any maps or analysis that utilise this data.
See full details here: https://www.ons.gov.uk/methodology/geography/licences
- Mark as New
- Bookmark
- Subscribe
- Mute
- Subscribe to RSS Feed
- Permalink
- Notify Moderator
I've got the beginner and advanced so far.

- Mark as New
- Bookmark
- Subscribe
- Mute
- Subscribe to RSS Feed
- Permalink
- Notify Moderator

- Mark as New
- Bookmark
- Subscribe
- Mute
- Subscribe to RSS Feed
- Permalink
- Notify Moderator
My solution.
I would not have been able to reach the result without the hint!
Workflow :
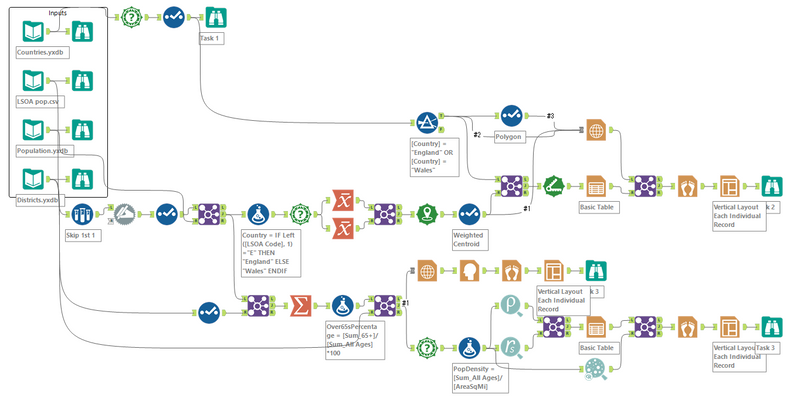
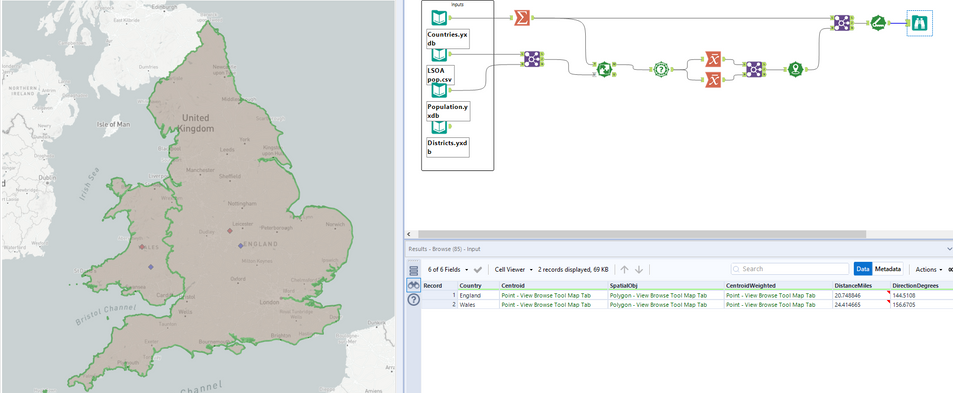
I was taken to the wrong answer by Spatial Match tool, so I replace it to Join tool.
Result :

Task 2
Task 3
- Mark as New
- Bookmark
- Subscribe
- Mute
- Subscribe to RSS Feed
- Permalink
- Notify Moderator
Definitely feeling dense trying to get the answer. I also stopped at the intermediate answer.
- Mark as New
- Bookmark
- Subscribe
- Mute
- Subscribe to RSS Feed
- Permalink
- Notify Moderator
All three tasks completed!
- Mark as New
- Bookmark
- Subscribe
- Mute
- Subscribe to RSS Feed
- Permalink
- Notify Moderator
All 3 done. Got lazy on the report... No one is going the generate rows route for population center? Some sanity exists...
- Mark as New
- Bookmark
- Subscribe
- Mute
- Subscribe to RSS Feed
- Permalink
- Notify Moderator
- Mark as New
- Bookmark
- Subscribe
- Mute
- Subscribe to RSS Feed
- Permalink
- Notify Moderator
Save the advanced for another day!😁
I think the key for Intermediate is understanding of how to calculate the population-weighted centroids.
- Mark as New
- Bookmark
- Subscribe
- Mute
- Subscribe to RSS Feed
- Permalink
- Notify Moderator
-
Advanced
302 -
Apps
27 -
Basic
158 -
Calgary
1 -
Core
157 -
Data Analysis
185 -
Data Cleansing
5 -
Data Investigation
7 -
Data Parsing
14 -
Data Preparation
238 -
Developer
36 -
Difficult
87 -
Expert
16 -
Foundation
13 -
Interface
39 -
Intermediate
268 -
Join
211 -
Macros
62 -
Parse
141 -
Predictive
20 -
Predictive Analysis
14 -
Preparation
272 -
Reporting
55 -
Reporting and Visualization
16 -
Spatial
60 -
Spatial Analysis
52 -
Time Series
1 -
Transform
227
- « Previous
- Next »

