Alteryx Designer Desktop Discussions
Find answers, ask questions, and share expertise about Alteryx Designer Desktop and Intelligence Suite.- Community
- :
- Community
- :
- Participate
- :
- Discussions
- :
- Designer Desktop
- :
- Decision Tree output doesn't show Variable importa...
Decision Tree output doesn't show Variable importance plot
- Subscribe to RSS Feed
- Mark Topic as New
- Mark Topic as Read
- Float this Topic for Current User
- Bookmark
- Subscribe
- Mute
- Printer Friendly Page
- Mark as New
- Bookmark
- Subscribe
- Mute
- Subscribe to RSS Feed
- Permalink
- Notify Moderator
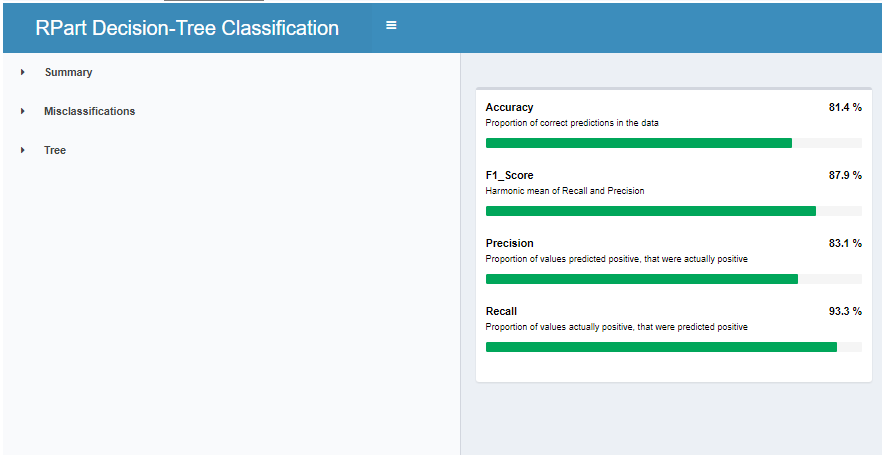
Hi. I can't see within the Decision Tree browse (O, R, I) the Variable importance plot. Can you help me to fix it?
Thanks
Solved! Go to Solution.
- Labels:
-
Output

- Mark as New
- Bookmark
- Subscribe
- Mute
- Subscribe to RSS Feed
- Permalink
- Notify Moderator
In your screenshot, you see the tool is operating as "RPart Decision-Tree Classification". I think this plot is only produced when the model type is "Regression" (Customize > Model Type and Sampling Weights > Regression).

From the tool documentation:
- If the target field is a member of a category set, a classification tree is constructed.
- If the target field is a continuous variable, a regression tree is constructed.
https://help.alteryx.com/2018.3/rpart.htm
My test found the Variable Important plot in I output > Variable Importance.
- Mark as New
- Bookmark
- Subscribe
- Mute
- Subscribe to RSS Feed
- Permalink
- Notify Moderator
Hi Charlie. Thank you for your clear explanation. Unhappily, your suggestion didn't work. I tried the 3 options: Auto, Classification, and Regression, none of the options showed up the Variable importance plot. It might be an Alteryx bug.
Thanks again
- Mark as New
- Bookmark
- Subscribe
- Mute
- Subscribe to RSS Feed
- Permalink
- Notify Moderator
Hi Charlie. Thank you for your clear explanation. Unhappily, your suggestion didn't work. I tried the 3 options: Auto, Classification, and Regression, none of the options showed up the Variable importance plot. It might be a Alteryx bug.
Thanks again
- Mark as New
- Bookmark
- Subscribe
- Mute
- Subscribe to RSS Feed
- Permalink
- Notify Moderator
Could you provide a sample of your data to test with?
- Mark as New
- Bookmark
- Subscribe
- Mute
- Subscribe to RSS Feed
- Permalink
- Notify Moderator
I think i found out how to fix the problem - it is a Tool version issue. Do the following:
- Add the Decision Tree Tool to the canvass
- Right click on it
- Select "Choose Tool Version"
- You will see three options - select the second option (i.e. Decision Tree 1.0)
I ran into the same issue and it consumed a lot of time looking for solutions. I hope that helps
- Mark as New
- Bookmark
- Subscribe
- Mute
- Subscribe to RSS Feed
- Permalink
- Notify Moderator
Thank you so much - my output looked completely different and this fixed it. Lifesaver! Thank you so much.
- Mark as New
- Bookmark
- Subscribe
- Mute
- Subscribe to RSS Feed
- Permalink
- Notify Moderator
Hi @Fran @kittymilburn ,
Thank for your supports. To empower users interpreting and explaining their predictive model, we recently published a new set of model explanation macros: LIME & SHAP in this post.
It supports Decision Tree and other predictive tools like Random Forest, SVM, etc. Give a try and see if it could help you!
-
Academy
6 -
ADAPT
2 -
Adobe
203 -
Advent of Code
3 -
Alias Manager
77 -
Alteryx Copilot
24 -
Alteryx Designer
7 -
Alteryx Editions
91 -
Alteryx Practice
20 -
Amazon S3
149 -
AMP Engine
250 -
Announcement
1 -
API
1,206 -
App Builder
116 -
Apps
1,359 -
Assets | Wealth Management
1 -
Basic Creator
14 -
Batch Macro
1,554 -
Behavior Analysis
245 -
Best Practices
2,690 -
Bug
719 -
Bugs & Issues
1 -
Calgary
67 -
CASS
53 -
Chained App
267 -
Common Use Cases
3,820 -
Community
26 -
Computer Vision
85 -
Connectors
1,424 -
Conversation Starter
3 -
COVID-19
1 -
Custom Formula Function
1 -
Custom Tools
1,935 -
Data
1 -
Data Challenge
10 -
Data Investigation
3,485 -
Data Science
3 -
Database Connection
2,216 -
Datasets
5,216 -
Date Time
3,226 -
Demographic Analysis
186 -
Designer Cloud
738 -
Developer
4,364 -
Developer Tools
3,525 -
Documentation
526 -
Download
1,036 -
Dynamic Processing
2,935 -
Email
927 -
Engine
145 -
Enterprise (Edition)
1 -
Error Message
2,253 -
Events
196 -
Expression
1,867 -
Financial Services
1 -
Full Creator
2 -
Fun
2 -
Fuzzy Match
711 -
Gallery
666 -
GenAI Tools
3 -
General
2 -
Google Analytics
155 -
Help
4,704 -
In Database
965 -
Input
4,290 -
Installation
360 -
Interface Tools
1,900 -
Iterative Macro
1,091 -
Join
1,956 -
Licensing
252 -
Location Optimizer
60 -
Machine Learning
259 -
Macros
2,858 -
Marketo
12 -
Marketplace
23 -
MongoDB
82 -
Off-Topic
5 -
Optimization
750 -
Output
5,246 -
Parse
2,325 -
Power BI
227 -
Predictive Analysis
936 -
Preparation
5,161 -
Prescriptive Analytics
205 -
Professional (Edition)
4 -
Publish
257 -
Python
853 -
Qlik
39 -
Question
1 -
Questions
2 -
R Tool
476 -
Regex
2,339 -
Reporting
2,429 -
Resource
1 -
Run Command
573 -
Salesforce
276 -
Scheduler
410 -
Search Feedback
3 -
Server
628 -
Settings
932 -
Setup & Configuration
3 -
Sharepoint
624 -
Spatial Analysis
599 -
Starter (Edition)
1 -
Tableau
512 -
Tax & Audit
1 -
Text Mining
468 -
Thursday Thought
4 -
Time Series
430 -
Tips and Tricks
4,183 -
Topic of Interest
1,126 -
Transformation
3,721 -
Twitter
23 -
Udacity
84 -
Updates
1 -
Viewer
3 -
Workflow
9,965
- « Previous
- Next »