Dev Space
Customize and extend the power of Alteryx with SDKs, APIs, custom tools, and more.- Community
- :
- Public Archive
- :
- Dev Space
- :
- Re: HTML Tool Challenge | BUILD an HTML tool and w...
HTML Tool Challenge | BUILD an HTML tool and win a prize!
- Subscribe to RSS Feed
- Mark Topic as New
- Mark Topic as Read
- Float this Topic for Current User
- Printer Friendly Page
- Mark as New
- Subscribe to RSS Feed
- Permalink
HTML Tool Challenge
The Python contest was fun - let's run it back!
To enter the contest:
- Create an HTML tool (the back end can be a macro, Python, or C++) and package it as a YXI file.
- Reply to this thread with a description of your tool. Don't forget to link to or attach your YXI.
- Get stars! Threaten, bribe, or maybe just tweet. Whoever gets the most stars by November 28th wins!
You'll have to make a decision: keep working on your tool closer to the deadline to make it as perfect as possible, or submit it early so you have time to socialize your post to get as many stars as possible?

☝️☝️☝️ The winner will receive a Nintendo Super NES Classic Edition 🌋🌋🌋
👇👇👇 All entrants will be rewarded with the HTML Contest badge 🔥🔥🔥

Subscribe to this thread or check back here (htmlcontest.alteryx.com) to vote as new tools are submitted!
Solved! Go to Solution.
- Labels:
-
SDK
- Mark as New
- Subscribe to RSS Feed
- Permalink
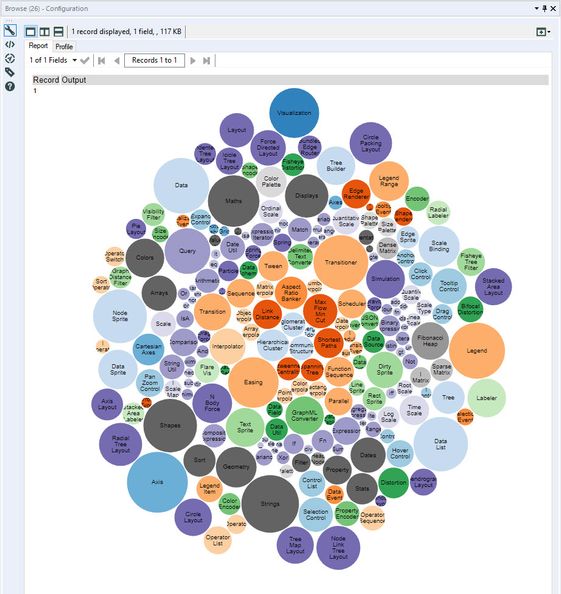
My entry is AlterD3... create custom interactive visualisation which can be displayed in reporting. Taken the concept from the NVD3 and built a new UI and new method of working. It does depend on the CReW macros as well (at present) - to produce the JSON data needed.
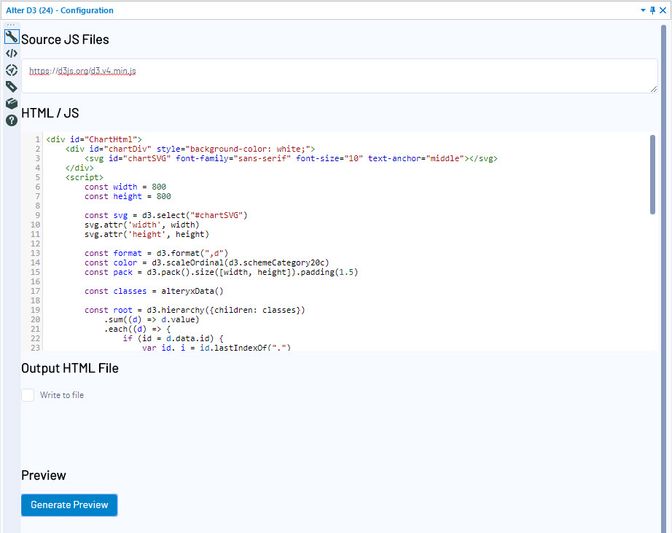
To make it more fun the configuration UI support syntax highlighting (embedded CodeMirror editor) and loading any JavaScript source URLs you need. This allows you to create any visualisation you like within Alteryx's browse tool.
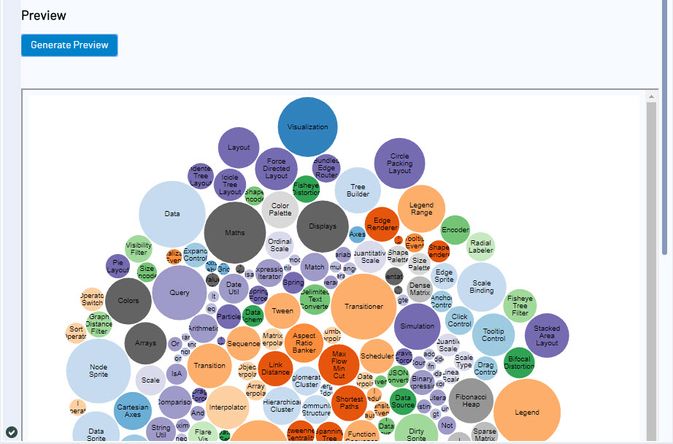
The final button in UI allows for a designer time preview. Currently, it reads the first 1000 records and builds the output in the panel below:
The YXI file can be download here. Source code is on GitHub.
Attached sample generating the bubble report above.
- Mark as New
- Subscribe to RSS Feed
- Permalink
Ever heard of IFTTT? If not then you are in for a treat! Ever wanted to get an email after a workflow ran? How about a text? What about a Tweet? If so, then you are in for a double treat!
IFTTT stands for " if THIS than THAT". Simply put, IFTTT is a platform creating workflows that connect services (applications, social media, IoT, etc) together. If it's on the internet, IFTTT can probably connect to it.
What are THIS and THAT you ask? Here's an example of an 'Applet' that I use:
 |
if (ASTRONAUT ENTERS SPACE) then (SEND MY ANDROID PHONE A NOTIFICATION) |
IFTTT can connect to tons of neat services and send you notifications via email, send you a text, add events on your Google Calendar, insert records in Salesforce, post on LinkedIn, Tweet, add to a Spotify playlist..... the list goes on. So let take advantage of this platform to connect to Alteryx!
The above item is called an Applet/Recipe. Let's set up our own - for my use case I'm going to send myself a text when my workflow runs. So my recipe is:
if (Alteryx workflow runs) then (send me a text message)
To get the first part running, I used a service called Webhooks - this service allows you to send a POST request as a trigger. Webhooks provides you with a key and a URL to send the request to, and all you need to send is an Event Name and (optional) a JSON body to pass values to the downstream service. I'm going to use these values to send the name of the workflow, and a message.
Some additional details on what the POST request should look like
Now it's time to set up my recipe:
Now, time for Alteryx! Introducing the IFTTT Trigger Macro:
The configuration window allows you to enter your Webhooks key (which is obtained from IFTTT) and your Event name (which you created when you made the Applet). In my example it was alteryx-test. The configuration also shows the IFTTT status page that monitors an interruptions to any of the services that IFTTT supports. To use the macro, I'll drop this right at the end of my workflow, just like if I were using an Email tool.
Let's get back to those optional JSON values mentioned before - if ticked, you now have the option to enter in up to three values. These correspond with the values in the dropdown that we set when we configured the text message we sent:
In the macro, I'm going to set [Value1] to be my workflow name, and [Value2] to be some text. The [OccurredAt] is built-in, so no need to worry about manually passing the time. Since I have already ran this macro, my key has been stored, so I'm going to select the Use last stored key button.
and... success!!
If you'd like to use the tool, you can create an IFTTT account at https://ifttt.com/. The macro is compatible with 2018.3.
Send me a tweet to let me know what cool Applets you make! I'd love to see some cool Hue lights flashing Hot Sauce after a workflow runs ;)
Senior Solutions Architect
Alteryx, Inc.

- Mark as New
- Subscribe to RSS Feed
- Permalink
I love exploring the outdoors! I like to go on runs/hike and have been using an app called Strava. Strava tracks my statistics such as elevation, distance, speed, latitude, longitude and related areas. This helps me better understand my workouts, trails that I have hiked on and acts as a repository for my activity.
Below is what it looked like upon completion:
 HTML SDK Workflow
 How the Connector looks up
 Tableau Dashboard
With this connector, I was able to create a single repository where I can bring in the data and create reports on a weekly basis. I was also able to compare my rolling activities, week over week, as well as bring information from my friends into the mix. I was able to use the scheduling feature of Alteryx Gallery and schedule this report on a weekly basis. This saved me time to create my own report weekly and compare my activity statistics weekly, saving about 30 minutes each week.
Alteryx
- Mark as New
- Subscribe to RSS Feed
- Permalink
Peter Gamble-Beresford and I are both Tableau and Altteryx Consultants for The Information Lab; but one thing we are definitely not is software/web developers. However, as part of our role as consultants, we need to keep on top of advancements in the products, and one that was on our to do list (you'll see what I've done there as you read on), was to look into developing a HTML GUI Alteryx macro and we'd had sufficient inspiration at the Alteryx conference in the US for this to make it's way up our priority list.
Peter is an avid fan of todoist and uses it on his day to day (https://todoist.com/?lang=en), if you haven't heard of it, it's an online task management tool. I'm an avid fan too, but I'm also too disorganised for this ever be managed well. Todoist also has a fantastic API, which allows you to create tasks.
We saw a gap in the Alteryx macro market, for a tool that made use of this API to create a task as an alerting mechanism for workflow owners. If the workflow fails, create a task that tells the workflow owner to investigate.
__
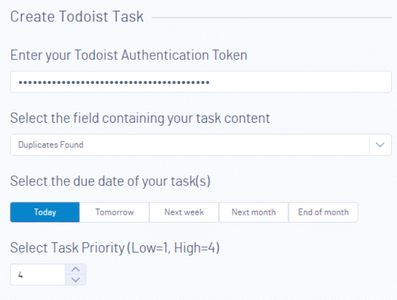
So let's take a look at the interface we created. It's simple and clean, that's what I love about the placeholder widgets Alteryx have created for the HTML GUI SDK.
Of course, with this being an API based macro, there is a need for an API token. There's no paywall around this with todoist. Once you have logged in online you can go to settings > intergrations, and then your API token will be at the bottom (the instructions for using the todoist API can be found here).
Given that we had no software developer experience we needed a how to guide, we had @Ozzie to help us with this post.
___
The macro itself is so simple its not even worth going over! But an example usecase definitely is. We have also attached the workflow if people wish to try it themselves (note, of course you will need to add your own todoist API token!).
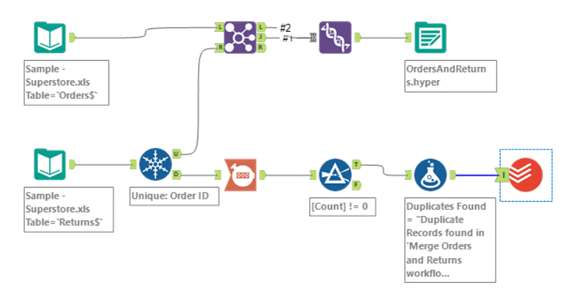
In the below example I am creating a todoist task in instances where there are duplicate records in one of my data streams. To 'Create Todoist Task' macro will create a task for every line of data, so we have used the count tool, to create one line, and of course we only want to create a task if there are duplicate records, so I use the filter tool to create a true stream only containing the count if it is greater than 0.
We then use a formula tool to generate an task subject and simply connect the macro.
When I hit run, I can then switch to my todoist web app, and voila, I now have a bossy workflow, who is telling me to fix it.
__
This workflow does work, as is, but there's a few development ideas that Peter and I have on the roadmap.
Firstly, We'd like to change the colour scheme of the macro interface, from blue to red, in order to match with the todoist macro, so if anyone knows how the hell we can do this please reach out!
Secondly, todoist has a categorisation manager built in to, so all tasks sit in a category, or project as they are referred to. We'd love for the user to be able to get a list of projects, which they can then select from in order to provide this category to their task.
This would require a two step process. Use the API Token to get the list of projects, and present this to the user, and then post the task. The Publish to Tableau Server tool seems to do something very similar, so we need to look into this, but our brains tell us, this is all slightly over our head for now! But look out, because I'm planning on cracking @jdunkerley79's brain for this.
___
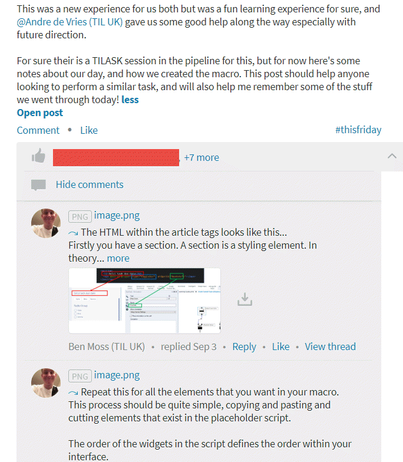
Now, it's fine for The Information Lab to give us self development time so we can look at things like this, but of course they want something back from us, they want us to help educate others on how they can do this too. So there will be a public facing blog at some point (though with @Ozzie's post already out there, it may not be needed!).
But we have posted internally about our experiences, and hopefully this will lead to a few HTML GUI macros in the future!
It's felt great to be able to achieve this in about half a days work and it wouldn't have been possible without the tools Alteryx have created to make this task so much eaesier!
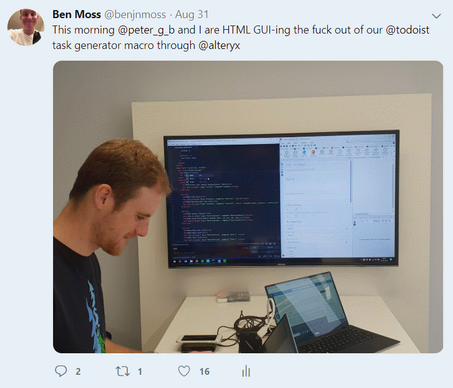
Here's a picture from our day.
Thanks. Ben and Peter.
- Mark as New
- Subscribe to RSS Feed
- Permalink
@BenMoss (and Peter) - first off I love it! I've been hearing a real buzz lately about Todoist; now I definitely need to check it out.
I also think it would be pretty sweet to update the colors to match - give the Debug mode a try. You can apply the changes directly from the Styles tab to see what it would look like:
Then, you can either create a custom css file and include it with your tool, or you can simply edit the HTML directly (I used the color #e44232 which I grabbed from their website):
Of course this is just for debugging, so be sure once you have the styles you like in place to make the edits to your actual HTML file.
Senior Solutions Architect
Alteryx, Inc.

- Mark as New
- Subscribe to RSS Feed
- Permalink
Have been having issues uploading the installer. It lives here.
I've been a fan of swarmplots for a while and was hoping that the new integration with Plotly would bring them to Alteryx. Well, fear not, at InfoLab I had a couple of days to pursue a personal project so I followed @BenMoss and Peter Gamble-Beresford's steps in the HTML tool journey so... here we have the new BeeSwarm Tool:![swarmplotIcon-nz0qsa94s8vkbxf1dl30owjic83br5lwzb6lu7zilk[1].png The BeeSwarm Tool](https://community.alteryx.com/t5/image/serverpage/image-id/47932i7BC0216E9E03F9AE/image-size/large?v=v2&px=999)
![SampleOutput-1[1].png Some Sample Outputs](https://community.alteryx.com/t5/image/serverpage/image-id/47933i55F3CF4D2229EBB5/image-size/large?v=v2&px=999)
The interface needs to be initialized before using it (connect it in the stream of data and run the workflow once so that the tool becomes aware of the fields available):
![config12[1].png Configuration of The BeeSwarm](https://community.alteryx.com/t5/image/serverpage/image-id/47934i10A77ACCC7DC66DB/image-size/medium?v=v2&px=400)
The tool expects a wide dataframe (variables in columns, records in rows).
Required settings:
The only required setting is at least one numeric variable needs to be chosen.
Outside the tool, in the workflow, an Image tool is required to convert the blob object into a png image.
Optional settings:
- A categorical variable can be selected to colour each dot in the variables by the row id (i.e. species in the iris dataset). If this column is missing, all the dots within a variable will be coloured the same way.
- A colour column with the colour assigned to each record id based on the categorical variable selected above (i.e. species). If this column is not present, colours will be assigned randomly. Currently, a colour column cannot be passed if the split-by variable is not specified.
- Options to select whether to despine/trim the axes or hide the legend.
- Options to overlay a boxplot or violinplot on top of the swarmplot (when selected, the dots will have the opacity reduced).

Attached the installer and a sample workflow.
Hope you find it useful!
It's been quite a learning experience. Main issues faced:
- HTML related:
- Making (some of) the widgets to work: I would copy one of the widgets in the HTML GUI example and place it in my Gui.html. It would appear on the interface in the tool with the string options I selected in the dropdown. I could select the option I wanted to. But, when running the workflow, that datafield would not even exist for Python. I spent a while opening other tools configs and trying whatever until this seemed to do the trick (DropDownOverlay was the dataName):
Alteryx.Gui.AfterLoad = function (manager, AlteryxDataItems) { const DropDownOverlay = manager.getDataItem('DropDownOverlay1') }- I don't know or understand HTML/css so even getting the letters to colour properly was a nightmare.
- Python related:
- Alteryx doesn't admit an image directly from the Python SDK (and the restrictions seem to be even greater in the Python Notebook Tool) so I had to find a workaround to send a Blob output.
- It seems relatively easy to build a tool using the Python module that alters records as they are coming into. I found it much more difficult to build one that first accepts all records, then does something (build a graph here, but could be anything) and then spits an output (This thread was helpful). It is much much easier on the Python Notebook Tool.
- Related with the previous point: I didn't know how to start with two inputs, one the dataframe and another a list/table of colours, and then combine them inside the tool. It is also much easier on the Python Notebook Tool.
Have been having issues uploading the installer. It lives here.
- Mark as New
- Subscribe to RSS Feed
- Permalink
Can't update original entry so here is version 1.1 of AlterD3:
- New feature is integration with examples:
This is done by reading from GitHub Gists (currently within my public space).
Currently, there are 3 bar chart examples and the bubble plot available but this list will grow.
Another example:
Will add the ability to save to a gist in the next version and allow for reading from any user account
- Mark as New
- Subscribe to RSS Feed
- Permalink
Thanks for the share Sophia! I thought of tackling a similar project myself with IFTTT, I will definitely try this out
-
.yxi
29 -
Administration
1 -
API
81 -
API Output Tool
18 -
Best Practices
3 -
Connect SDK
9 -
Connectors
4 -
Custom Formula Function
30 -
Custom Tools
136 -
Developer
161 -
Developer Tools
4 -
Gallery
55 -
Help
3 -
HTML GUI
65 -
Input
2 -
Iterative Macro
1 -
JavaScript
32 -
Macro
29 -
Macros
3 -
Optimization
1 -
Python
115 -
Salesforce
1 -
Scheduler
1 -
SDK
143 -
Server
3 -
Workflow
1
- « Previous
- Next »

