Weekly Challenges
Solve the challenge, share your solution and summit the ranks of our Community!Also available in | Français | Português | Español | 日本語
IDEAS WANTED
Want to get involved? We're always looking for ideas and content for Weekly Challenges.
SUBMIT YOUR IDEA- Community
- :
- Community
- :
- Learn
- :
- Academy
- :
- Challenges & Quests
- :
- Weekly Challenges
- :
- Re: Challenge #93: Pumpkin Production
Challenge #93: Pumpkin Production
- Subscribe to RSS Feed
- Mark Topic as New
- Mark Topic as Read
- Float this Topic for Current User
- Bookmark
- Subscribe
- Mute
- Printer Friendly Page
- Mark as New
- Bookmark
- Subscribe
- Mute
- Subscribe to RSS Feed
- Permalink
- Notify Moderator
A solution to last week's Challenge can be found HERE. I love that some Challengers submitted a solution using the Image tool. It's just one more reminder that there's almost always more than one way to accomplish a task with Alteryx!
I'm sure it comes as no surprise to anyone from Illinois, but the Land of Lincoln gives us much to be thankful for: the Ferris Wheel, deep dish pizza, the creative geniuses who invented Twinkies (thanks but no thanks)....the list goes on and on! However, there is one thing for which we should be extra thankful, especially this time of year: Illinois produces pumpkins...LOTS of pumpkins! In fact, the great state of Illinois has been the leading pumpkin producer in the US since at least the year 2000 (according the the USDA and its freely available dataset). Just think: the rise of all things pumpkin spice flavored may not have been possible without the pumpkin producing prowess of the state of Illinois!
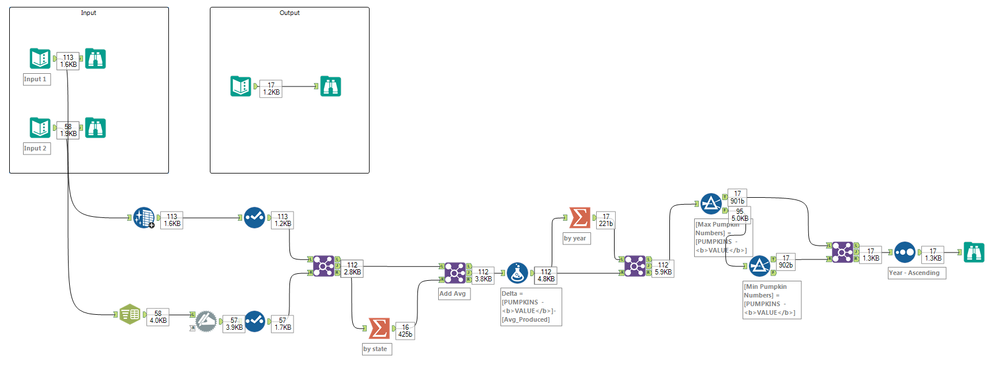
For this week's Challenge, we'll be preparing and transforming data with the goal of identifying the most and least productive pumpkin producing states for the years 2000 to 2016. Input Data 1 contains information on pumpkin production for different states (indicated by ANSI codes) for the years between 2000 and 2016. Input Data 2 contains a pipe delimited lookup table for state ANSI codes. Using the Inputs, create a table that identifies the most and least productive states with respect to pumpkin production volume. Compare the production values to the average production for that state.
- Mark as New
- Bookmark
- Subscribe
- Mute
- Subscribe to RSS Feed
- Permalink
- Notify Moderator
- Mark as New
- Bookmark
- Subscribe
- Mute
- Subscribe to RSS Feed
- Permalink
- Notify Moderator
- Mark as New
- Bookmark
- Subscribe
- Mute
- Subscribe to RSS Feed
- Permalink
- Notify Moderator
I'm interested to see how people did this with fewer joins!
- Mark as New
- Bookmark
- Subscribe
- Mute
- Subscribe to RSS Feed
- Permalink
- Notify Moderator

- Mark as New
- Bookmark
- Subscribe
- Mute
- Subscribe to RSS Feed
- Permalink
- Notify Moderator
- Mark as New
- Bookmark
- Subscribe
- Mute
- Subscribe to RSS Feed
- Permalink
- Notify Moderator
- Mark as New
- Bookmark
- Subscribe
- Mute
- Subscribe to RSS Feed
- Permalink
- Notify Moderator
Back from a short Alteryx break while I changed employers... here's my solution for this week's challenge.
- Mark as New
- Bookmark
- Subscribe
- Mute
- Subscribe to RSS Feed
- Permalink
- Notify Moderator
- Mark as New
- Bookmark
- Subscribe
- Mute
- Subscribe to RSS Feed
- Permalink
- Notify Moderator
-
Advanced
302 -
Apps
27 -
Basic
158 -
Calgary
1 -
Core
157 -
Data Analysis
185 -
Data Cleansing
5 -
Data Investigation
7 -
Data Parsing
14 -
Data Preparation
238 -
Developer
36 -
Difficult
87 -
Expert
16 -
Foundation
13 -
Interface
39 -
Intermediate
268 -
Join
211 -
Macros
62 -
Parse
141 -
Predictive
20 -
Predictive Analysis
14 -
Preparation
272 -
Reporting
55 -
Reporting and Visualization
16 -
Spatial
60 -
Spatial Analysis
52 -
Time Series
1 -
Transform
227
- « Previous
- Next »


