by Philipp Maier and Viswanath Ravichandran
This post is the second installment of our series on Customer Managed Telemetry. In our first part, we outlined the setup of Customer Managed Telemetry and discussed some of the benefits and applications; in this second post, we detail a new workflow published as part of the Alteryx Enterprise Utility to analyze information from Customer Managed Telemetry. This Alteryx Enterprise Utility is available for free on the Alteryx Marketplace (search for "Enterprise Starter Kit" and select "Customer-Managed Telemetry").
In the sections below, we explain how to install the workflow, walk through its key steps, and outline design considerations when deploying Customer Managed Telemetry for an Enterprise at scale.
Before we dive into details, a few important reminders:
- Alteryx does not have access to data generated from Customer Managed Telemetry. The data is only accessible to the client.
- Customer Managed Telemetry is turned on by the customer, not Alteryx. This feature is for desktop users of Alteryx Designer, and turning it on is not required to run Alteryx Designer. That said, some of the techniques outlined can also be used to analyze the XMLs of workflows on the server.
- Turning on Customer Managed Telemetry might subject administrators to obligations under local privacy laws, such as the responsibility to disclose the collection of personal data.
What Is Customer-Managed Telemetry? A High-Level Overview
Customer Managed Telemetry provides information about users developing workflows on the desktop. This information helps manage risk, identify training opportunities, and gain insights into data connections. When Customer Managed Telemetry (CMT) is turned on, every time a user executes a workflow on the desktop, a log file is written out (Figure 1: High-level overview of Customer-Managed Telemetry). The log file contains basic information about the machine and the user, as well as the workflow in XML format (not the actual data). The XML file can be opened in a text editor and examined, but why inspect it manually when we can leverage Alteryx’s amazing automation capabilities to parse workflows automatically?
So, here’s our plan: after turning on Customer Managed Telemetry, we first collect log files from all users in a centralized location. Then, we use Alteryx to parse the log files and summarize the key insights on interactive dashboards in Tableau or PowerBI.
Our new Alteryx Enterprise Utility makes it easy for you to get started. Below we outline how the actual workflow works. In blue and grey boxes, respectively, we also point out some of the tips and tricks leveraged, as well as detailed information for those seeking additional customization and who are going deep into the details.
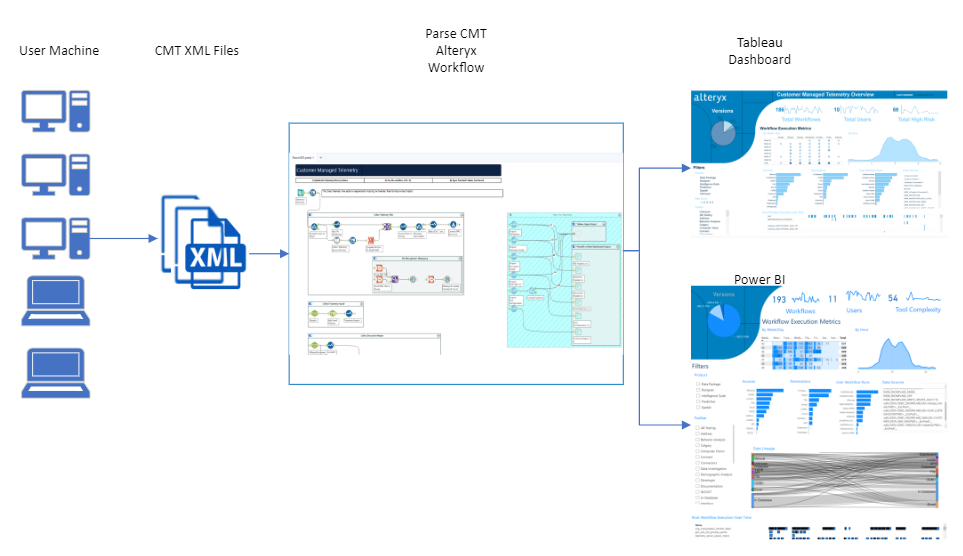
Figure 1: High-level overview of Customer-Managed Telemetry
Good to know: In what follows, we assume that you have turned on Customer Managed Telemetry for at least one desktop and have an initial set of log files to parse. If you are not sure how to turn it on, please check out our first blog post on the topic.
1. How to install and run the workflow
The Alteryx Enterprise Utility is available for free on the Alteryx Marketplace (Figure 2). Search for "Enterprise Starter Kit" and select "Customer-Managed Telemetry."
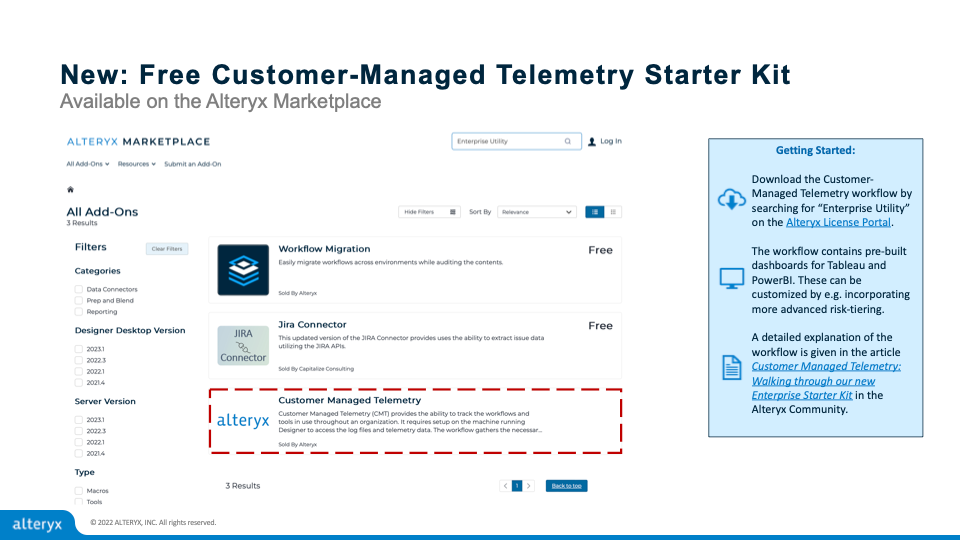
Figure 2: Downloading the new Enterprise Utility from Alteryx Marketplace
Once downloaded to your machine, double-click on the download, and the starter kit will install all necessary packages. To run it, go to the Help menu under Sample Workflows (Figure 3). Click on “Parse Customer Managed Telemetry” to open the workflow.
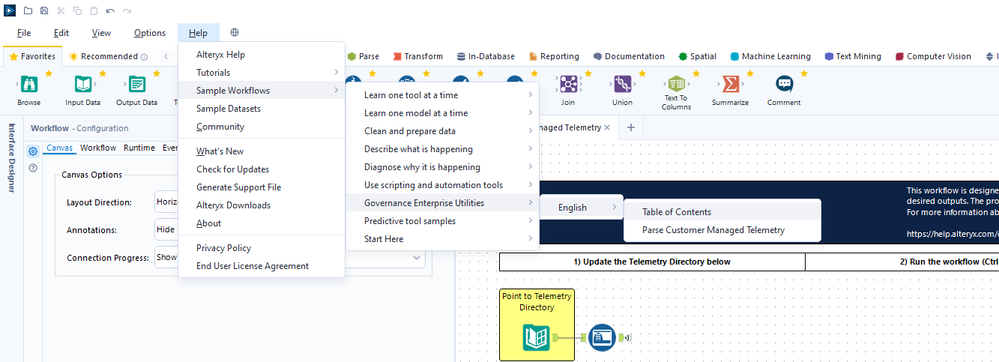
Figure 3: Running the Starter Kit
Before you run the workflow, you need to configure it. Leverage the two yellow boxes in the top-left of the workflow (Figure 4) to set up or review the following.
- First, you need to point it to the directory where you collect all the telemetry log files. This is done in the box labeled “Point to Telemetry Directory.” The chosen directory needs to contain the log files you want to parse.
- Second, the “Filter” tool setting in the other yellow box determines how many days of log files are parsed. As the number of users increases, log files accumulate quickly. The default is 45 days, but we give the option to adjust the setting to best suit your specific needs, as well as the number of users and workflows.
Once set up, hit “Run” to execute the workflow, and provided that your telemetry directory contains an initial set of telemetry log files, the workflow will parse and analyze.
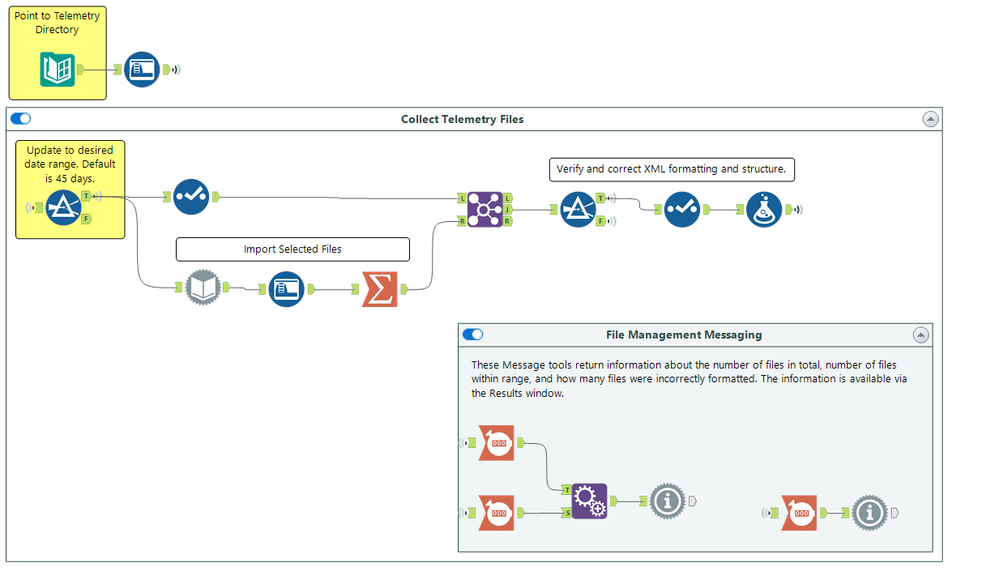
Figure 4: Configuring the workflow by reviewing and adjusting the tools in the yellow boxes
Good to Know: An optional configuration step involves the workflow output. By default, the output is pushed to a Tableau dashboard. Users without Tableau or wanting a different output can disable the Tableau output container.
If errors occur when reading in log files: Check the configuration of the dynamic input tool. To verify, with the dynamic input tool selected, click the “Edit” button in the top-left of the “Input Data Source Template” configuration field. The correct confirmation is shown in Figure 5: The delimiters setting should be set to “\0” and Field Length should be set to “1000000.” This will help with reading in large workflows.
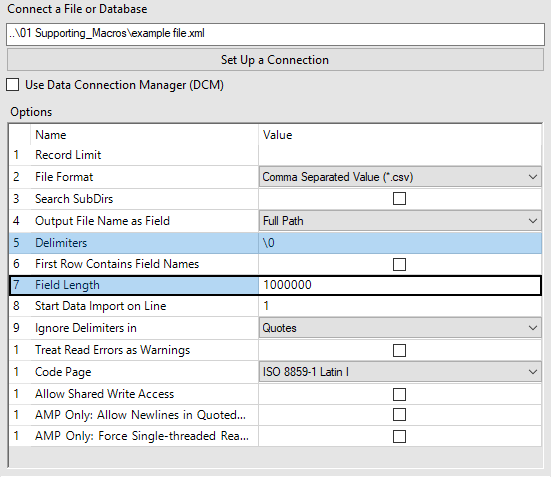
Figure 5: Correct Configuration of the Dynamic Input tool
Additional Details: If you want to find the workflow outside of Designer, it is by default stored in “C:\ProgramData\Alteryx\DataProducts\DataSets\Content.”
2. How the workflow works: Key Steps
The workflow consists of several components: first, the log files are collected, read in, and pre-processed. In the analysis step, tools are extracted from containers, categorized into tool categories, and tool details are extracted (including tool configuration and data connections). Lastly, the visualization and reporting step generates files to be used for dashboards and reports.
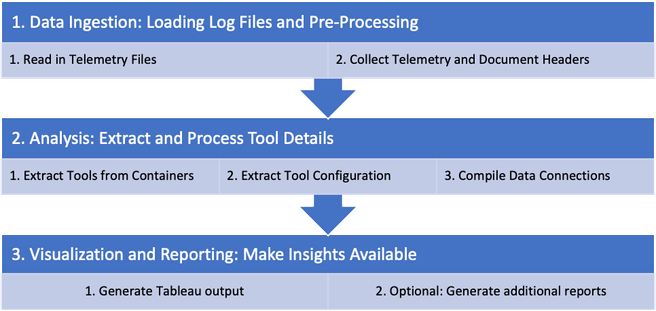
Let’s examine each step individually.
2.1 Data Ingestion: Loading Log Files and Pre-Processing
2.1.1 Read in Telemetry Files
The first step is to point the directory tool to the log file location. The dynamic input tool is used to read in all telemetry files from the source folder (indicated by the box “Import Selected Files” in Figure 4). All files are then formatted and parsed to a table format (indicated by the row of icons under “Verify and correct XML formatting”). Also, we added a container (shown at the bottom of Figure 4) providing user feedback: leveraging the messaging tools, we inform the user how many files are read in and processed in this section of the workflow. In the rare instance of a file not being processed due to formatting issues, an alert is issued, allowing the user to identify the file and inspect it manually.
Good to Know: The workflow uses a sample.xml file as a template located in the same directory as the workflow.
2.1.2 Process Telemetry and Document Headers
Next, we need to parse the telemetry and document header of the log files. Figure 6 provides the relevant section in the workflow. From the telemetry header, we extract information such as who ran the workflow, the machine name, source file details with time stamp, etc. Of interest is that we also collect the AyxGlobalUID – this is essentially a “workflow identifier” which will allow us to connect log files of the same workflow together (this enables reporting on successive workflows run, allowing, e.g., to identify users manually running the same workflow at regular intervals on their desktop).
The document header contains information about the settings in a workflow. Information contained in file headers does not require further processing and is directly exported to Tableau or PowerBI (see section 2.3 Visualization and Reporting for details on reporting). Lastly, two separate workflow containers summarize the telemetry and document headers, which are directly passed to Tableau as file outputs.
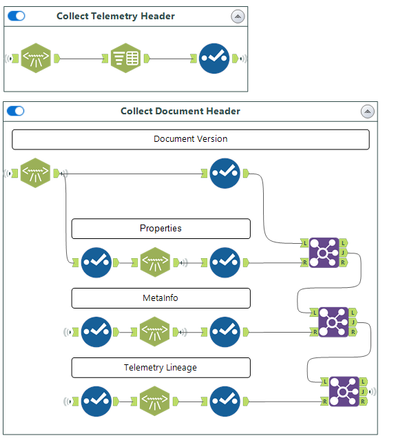
Figure 6: Parsing the Telemetry and Document headers
2.2 Analysis: Extract and Process Tool Details
With the pre-processing out of the way, the real work can begin: in this section, we focus on what the workflow is doing by extracting and processing workflow information.
2.2.1 Extract Tools from Containers
As workflows become more complex, one best practice we always recommend is to leverage containers. Containers may also contain additional containers (“nested containers”), so when processing the workflow, our first step is to go through all containers and extract the relevant tool information. Figure 7 shows how the workflow extract all tools from their containers, parses the XML, removes unwanted columns, and unions the relevant information together.
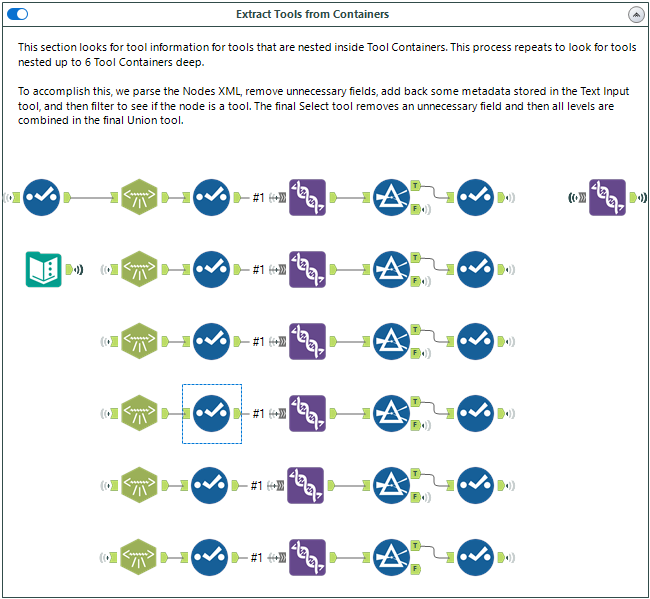
Figure 7: Extracting Tools from Containers
Good to Know: As workflows may contain nested containers, the workflow runs multiple passes. This ensures that all tools are captured, even if containers are nested up to 6 layers deep (see Figure 7). Technically, this is done with the “Filter” tool, which checks if the XML file contains additional child nodes.
2.2.2 Extract Tool Configuration
After extracting tools from containers, the workflow parses the information obtained so far. This part of the workflow is fairly complex, and the exact processing step depends on the type of tool (see Figure 8). Technically, this is accomplished through a series of XML parse steps, which are best understood by running the workflow and going through the tools with some live data to understand the various steps. In what follows, we will tackle the workflow container row by row.
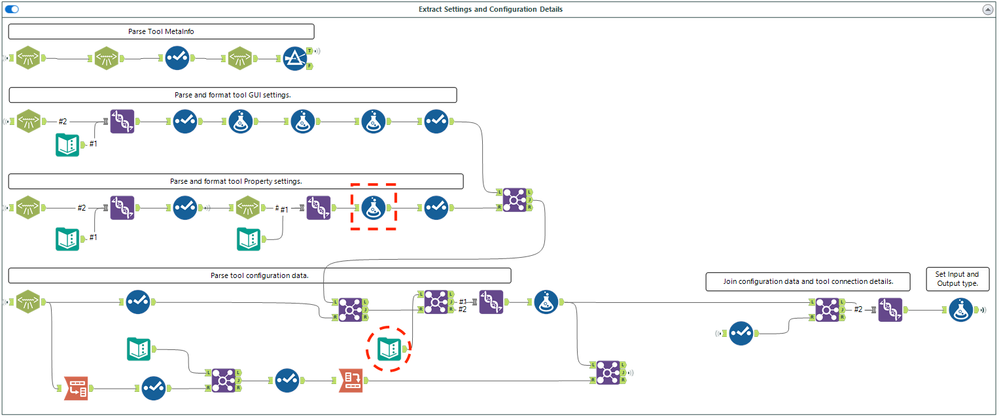
Figure 8: Extracting Setting and Configuration Details
The first two rows of workflow in this container retrieve the Metadata and GUI settings by parsing the specific XML child nodes “Metadata” and “GUISettings,” respectively. When parsing GUI settings, notice leveraging a template to ensure that information lines up in a clean format. A series of formula tools help slot all tools into their correct classifications, e.g., by fixing “Null” entries in the “Tool Group” column by assigning macros contained in a workflow to the tool group “Macro.”
When retrieving tool details by parsing the “Properties” and “Annotations” sections of the XML (third row in the container), templates are twice used to ensure that fields line up. A formula tool is used after the second Union tool (denoted by the red box) to override the default tool annotations for those cases where users have modified them.
Good to Know: The formula tool highlighted in the red box in Figure 8 can be leveraged for automated checks when promoting a workflow from development to production. Assume that best practices for building workflows include key steps in a workflow being documented through tool annotations. Here is an automated check ensuring that users leverage workflow annotations for documentation purposes: With the steps outlined above, an automated check can compare the original default annotation with the modified annotation to ensure that users leverage tool annotations as part of the documentation process before the workflow is put into production.
The last two rows of the container go through the “Configuration” column to retrieve the tool configuration. The upper section of this portion of the workflow joins the configuration with the tool properties information and then uses another “config” text input tool to augment the tool information. This text input tool is key to making the output on the telemetry dashboard easy to consume, and we have therefore circled it in red in Figure 8. It performs multiple functions:
- In this text input tool, we provide clear names for the tool (e.g., mapping “SelectRecord.yxmc” to “Select Records”), indicating which group the tool belongs to (“Select Records” is found in the “Preparation” tool group in the Alteryx Designer tool selection bar). The subsequent join then adds this information to each row to give each tool a clear name and tool group descriptions.
- Should future versions of Alteryx add additional tools, this text input may need to be adjusted to include these new tools as well.
- Information provided in this text input tool flags all tools that are either used to input or output data (in the “Input Flag” and “Output Flag” columns), so connection details can be retrieved in the next step.
- Lastly, this text input tool provides the configuration for the automated risk scoring. Risk scoring provides a simple way to flag workflows (potentially) requiring extra attention – either because they can lead to material financial or reputational losses or because they use Alteryx tools that could potentially be misused. For instance, workflows leveraging confidential data or writing back data to systems of records may warrant additional scrutiny relative to workflows that use public data to prepare a PowerPoint as input for non-critical business decisions.
The Enterprise Starter Kit workflow automatically assigns a “Risk Score” to each Alteryx log file parsed by adding risk metrics to each tool. In the last column, the numeric values represent risk scores for each tool, with, e.g., the Python or R tools – which are leveraged to add custom code – having relatively high values (a “5” on a scale of 1-5), signaling that the use of these tools may warrant an extra set of eyes on the workflow before it is promoted to production.
Good to Know: The risk scoring can be adjusted by changing the risk rating in the last column of the text input tool in the red circle in Figure 8. This enables customization of the risk scoring, and depending on specific needs or regulations, risk ratings for the different tools can be set to higher or lower levels.
Additional Details: For those interested in the details, an overview of the information extracted from tools is provided in Figure 9.
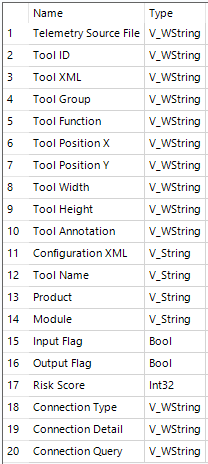
Figure 9: Information Stored About Tool Configurations
2.2.3 Compile Data Connections
Our last step is to extract the connection details for all input and output tools. Recall that the tools were classified as input or output tools in the text input “config” file contained in the red circle in 10. We use this information to focus on input and output tools in Figure 10. This step is particularly useful when compiling a list of all workflows leveraging a specific data source or checking where outputs of the workflows are written to.
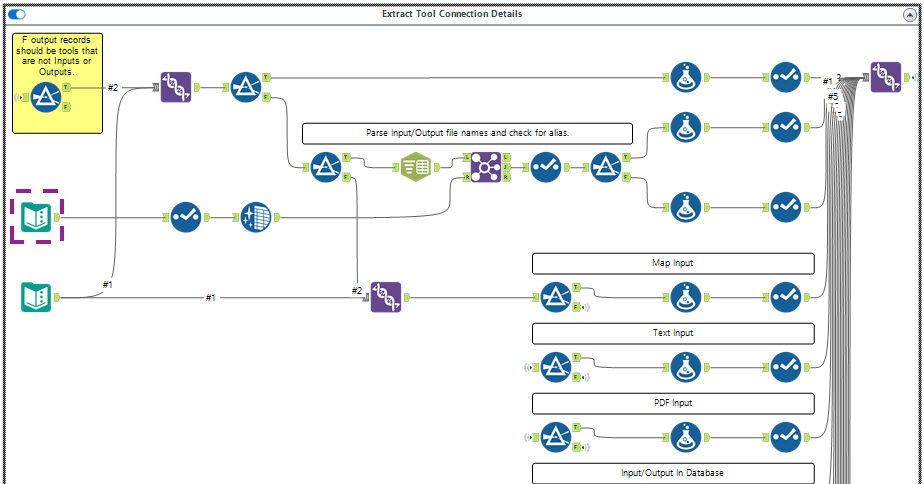
Figure 10: Compiling Data Connections
The purple box in Figure 10 first “Text Input” tool is leveraged to provide clear descriptions of all file formats, e.g., mapping the ending “xls97” to “Excel”; the second is again used as a template in the union tool to ensure that all data fields will line up. The first Filter tool in the top row of the container checks for file nodes and, if true, parses these out; the second Filter tool tests for input files and retrieves the file names of these connections. Additional steps are needed for those tools that are not input files (these could, e.g., be text or blob inputs, output files like a Tableau file, or various output or render tools like the email tool); these are parsed through a series of Filter tools separating the input type and subsequently the Formula tools adding connection details. For example, if a workflow contains a Text Input tool, the connection detail is classified as “Manual,” whereas a Tableau extract as output would be registered as “Dashboard.” The Union tool at the end combines all the information back together for use downstream.
Additional Details: After the final Filter tool, no remaining records should be showing at the “F” anchor, indicating that all tools were correctly classified. As an additional test, a red comment box at the bottom of this section provides feedback if anything goes wrong, enabling manual inspection of this particular file.
In our last analysis step, we provide a basic view of the flow of the data. Wouldn’t it be nice if one simple chart could show the distribution of data input sources and data outputs? Figure 11 provides a sample visual, indicating how in this example, manual data inputs (shown in blue on the left) tend to end up primarily in emails, whereas data read in through In-Database Tools (green on the left) also tends up to be written back to databases (green on the right).
To compile this information, the “Basic Lineage” container shown in Figure 12 separates tools into data inputs and data outputs. This chart shows data sources and destinations, with thicker lines representing larger shares of workflows falling into each category - i.e. there are relatively few workflows starting with manual data inputs and outputting data via OBDC connections vs. a much higher share starting with manual data and ending in an email. Records that cannot be joined do not have a complete lineage and are removed (the Join tool in the yellow box); Tile tools are used to reduce dimensionality. Two Join tools merge both data inputs and data outputs into a consistent table.

Figure 11: Basic Lineage, as Shown in PowerBI

Figure 12: Basic Lineage Container
2.3 Visualization and Reporting
The last section of the workflow prepares visualization and reporting. By default, the Enterprise Utility produces two sets of dashboards, one for Tableau and one for PowerBI. Both are stored in the same folder as the workflow. You can access both pre-configured dashboards through the “Table of Contents” of the Enterprise Starter Kit (Figure 3).
Reporting needs can differ, so this step may require additional customization. Because the PowerBI output is comma-separated values (CSV file), it can easily be tailored to the specific needs of a customer or Enterprise.
Good to Know: If not installed, please download and install the Tableau Output Tool from https://community.alteryx.com/t5/Community-Gallery/Tableau-Output-Tool/ta-p/877902
3. Deployment Considerations
Deploying customer-managed telemetry involves several decision points, including how and where to store log files, compiling key information in databases, and designing dashboards and alerts. For complex deployments, we recommend engaging the Alteryx Professional Services team (servicesops@alteryx.com) to discuss options and accelerate the time to insight. A few of the key considerations are outlined below.
3.1 Location (File/Folder Management)
If deployed at scale, log files will accumulate fast. For large Enterprises, careful upfront planning is needed to decide on file storage and location.
- Log files will only be written if the drive is accessible. Assuming that log files are written to a common network drive when associates are traveling and are disconnected from the network, log files will not be generated. This may be an acceptable risk if this also means that users cannot access corporate databases (notably those housing confidential data).
- An alternative is to specify a local directory that is automatically synchronized when the user reconnects with the Enterprise network. A drawback of this approach is an additional workflow may be needed to move all relevant files into a common directory for processing.
- Lastly, local privacy laws apply, which may necessitate storing each user’s workflow in a separate directory not visible to others.
3.2 Information Storing and Scheduling Considerations
The next choice points are related to identifying which information is needed and how long it should be stored. A few considerations:
- Some elements of the workflow may be useful to run frequently, e.g., to detect attempts to access confidential data. It may be helpful to build a separate, simplified workflow that can be scheduled to run on the server to parse data connections and generate alerts if new users access specific databases (this alert could also automatically generate audit trails).
- Some elements of the workflow may only need to be run or parsed very infrequently, such as an overview of Alteryx versions.
3.3 Report and Alert Design
Perhaps the most important choice relates to the types of reports or alerts needed. These should tie back to objectives (“what problem do we want to solve?”), leverage different ways to present information (e.g., emails vs. dashboards) and display only the necessary information to avoid overloading users and the dashboard.
Alteryx recommends distinguishing alerts from reporting cadence, i.e., information needed periodically. Leveraging the examples above, some users may find it useful to send an alert if a user suddenly accesses confidential data and could design a workflow to automatically send an email notification related to that access. In contrast, information on which Alteryx versions are being used or comparing tool usage across teams to identify training opportunities would rely on longer data collection periods, compiled less frequently and displayed in an interactive dashboard. Or a more complex use case could leverage machine learning to identify anomalies in access patterns across users and teams as part of entitlement management, requiring yet another report format.
Think About the Possibilities….
The general technique of parsing workflows and leveraging the XML file as a source of information has many cool applications, highlighting possibilities far beyond what we demonstrate in this workflow. Depending on your interests, we invite users to work out and share more detailed examples in future community posts, such as:
Automated Alerts: Having shown how we can retrieve data inputs and outputs used in the workflow, how about a shorter version that only focuses on access to confidential data but is scheduled to run in the background so every time a new user attempts to access restricted data, an automated alert is generated?
Testing for meaningful documentation: Our list of “Best Practices for Alteryx Workflow Governance” suggests leveraging Tool Annotations. How about adding a test if Tool Annotations are used in the workflow? If annotations are meaningful? This would be an automated way to check if the workflow meets documentation best practices.
Enhanced Risk Ratings: Based on the types of tools used, this workflow shows how to assign automated risk ratings. More complex risk tiering is possible; for instance, one could imagine different risk buckets (one for tools, one for data connection types, one for the complexity of the workflow, etc.), providing granular insights and automatically triggering additional reviews for high-risk workflows.
Automated Compliance Testing: Many financial institutions have policies around the use of forecasting tools, requiring periodic internal reviews. A workflow could collect all analytics containing forecasting tools and check compliance with Enterprise policies against an internal review system.
Let us know what you think!