Welcome back to Alteryx Tricks You Didn’t Know, the series where I intend to level up your Alteryx game. Each edition will have 5 quick tips, all based around a specific theme. If you missed the last episode on workflow configuration, check it out here.
This time: Visibility – Making it easier to see and understand your data.
1. 🔢 Enable Numeric Separators in the Results Window
This is a very small, but often overlooked trick: Did you know you can enable numeric separators in the results window for your numeric fields?
This makes it so much easier to distinguish values from thousands/millions without having to squint intensely at your screen.
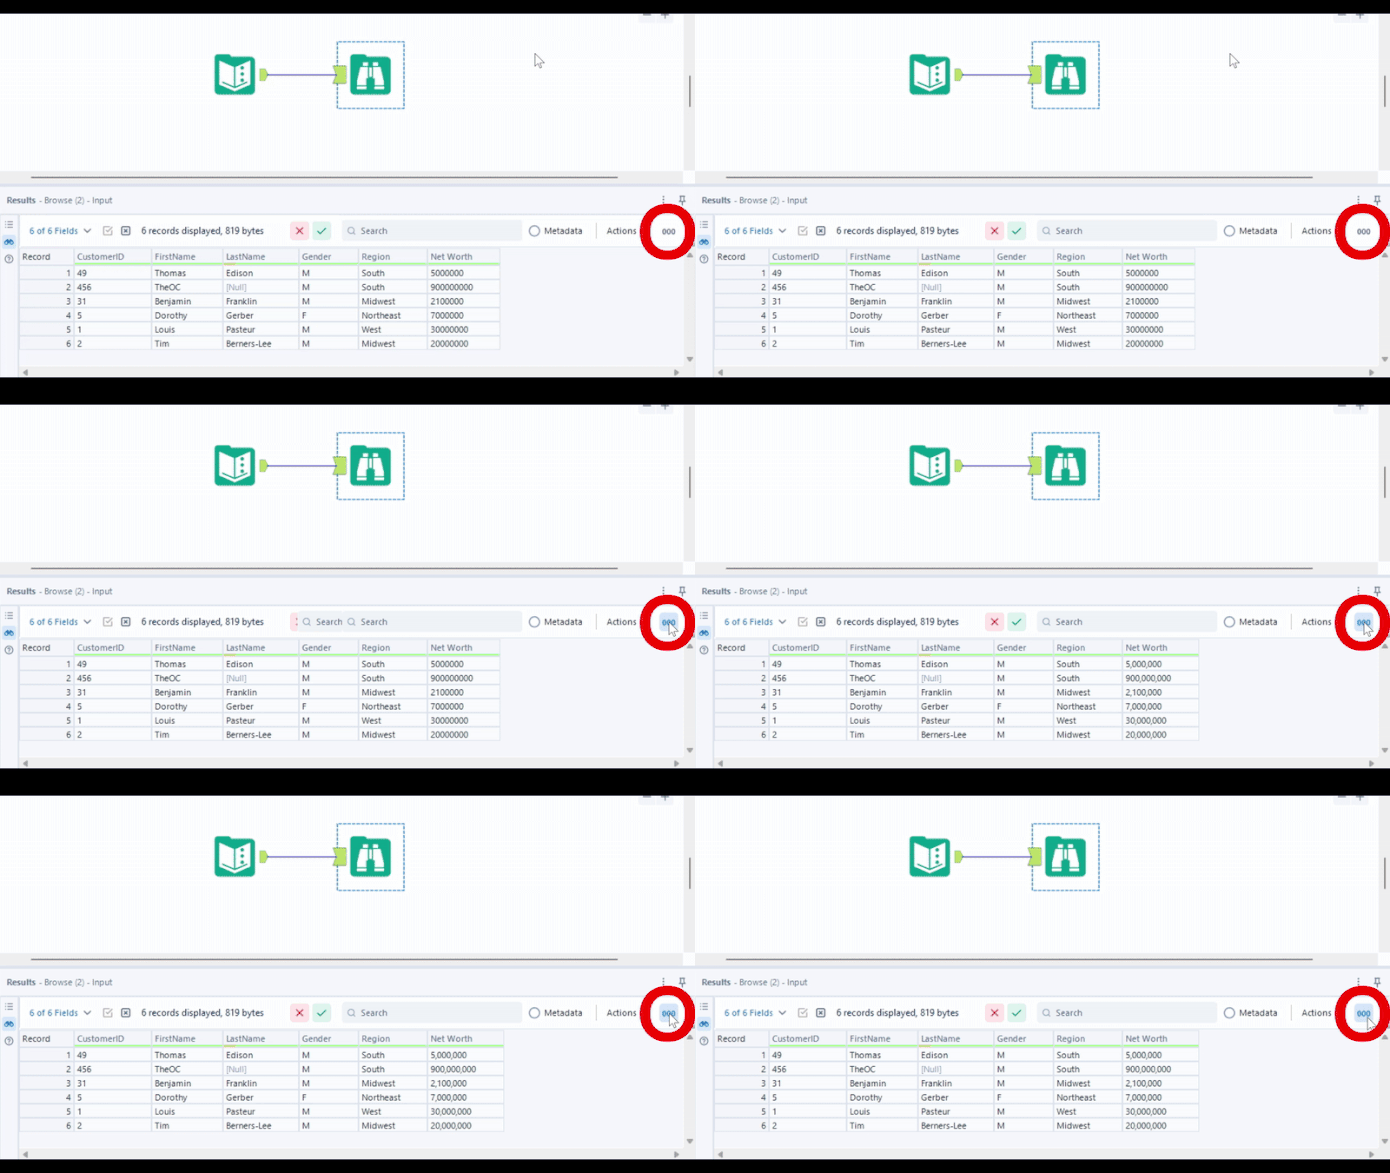
2. 👀 Cell Viewer – Quickly See Data Types and Your Data
You may have already noticed that double-clicking a cell in the results window opens the Cell Viewer, which lets you see that cell in more detail, including all data (in yellow) and data type (in red):
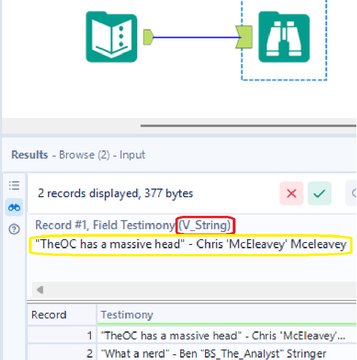
But there is more to this!
- Click the Column header to see metadata for that column (data type, size)
- Click the record number to see the bytes used by that row.
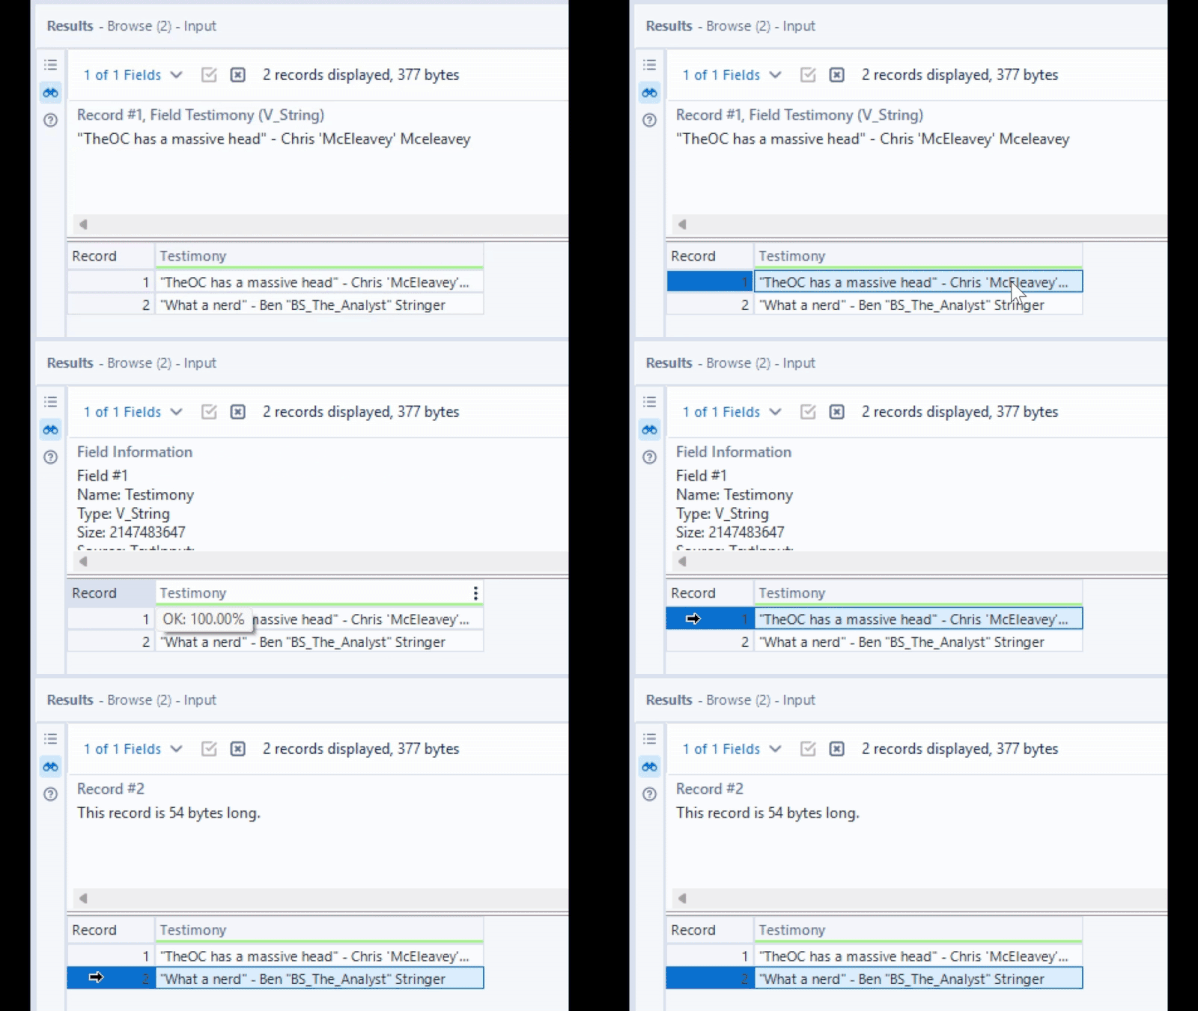
This is an underrated way to spot oversized strings, incorrect data types, or to interrogate larger datasets.
3. 📂 Explorer Box – View Outputs
The explorer box is possibly one of the least-used tools in Alteryx, and I think it’s incredible.
Most of the time I have seen it used, it’s to display a website (Regex cheat sheet, Alteryx Documentation, SharePoint documents):
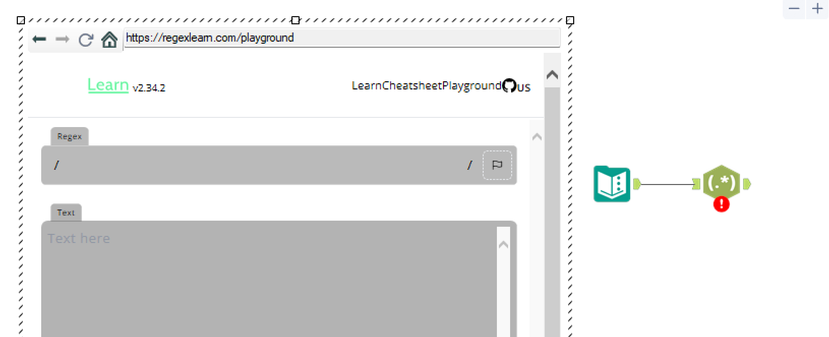
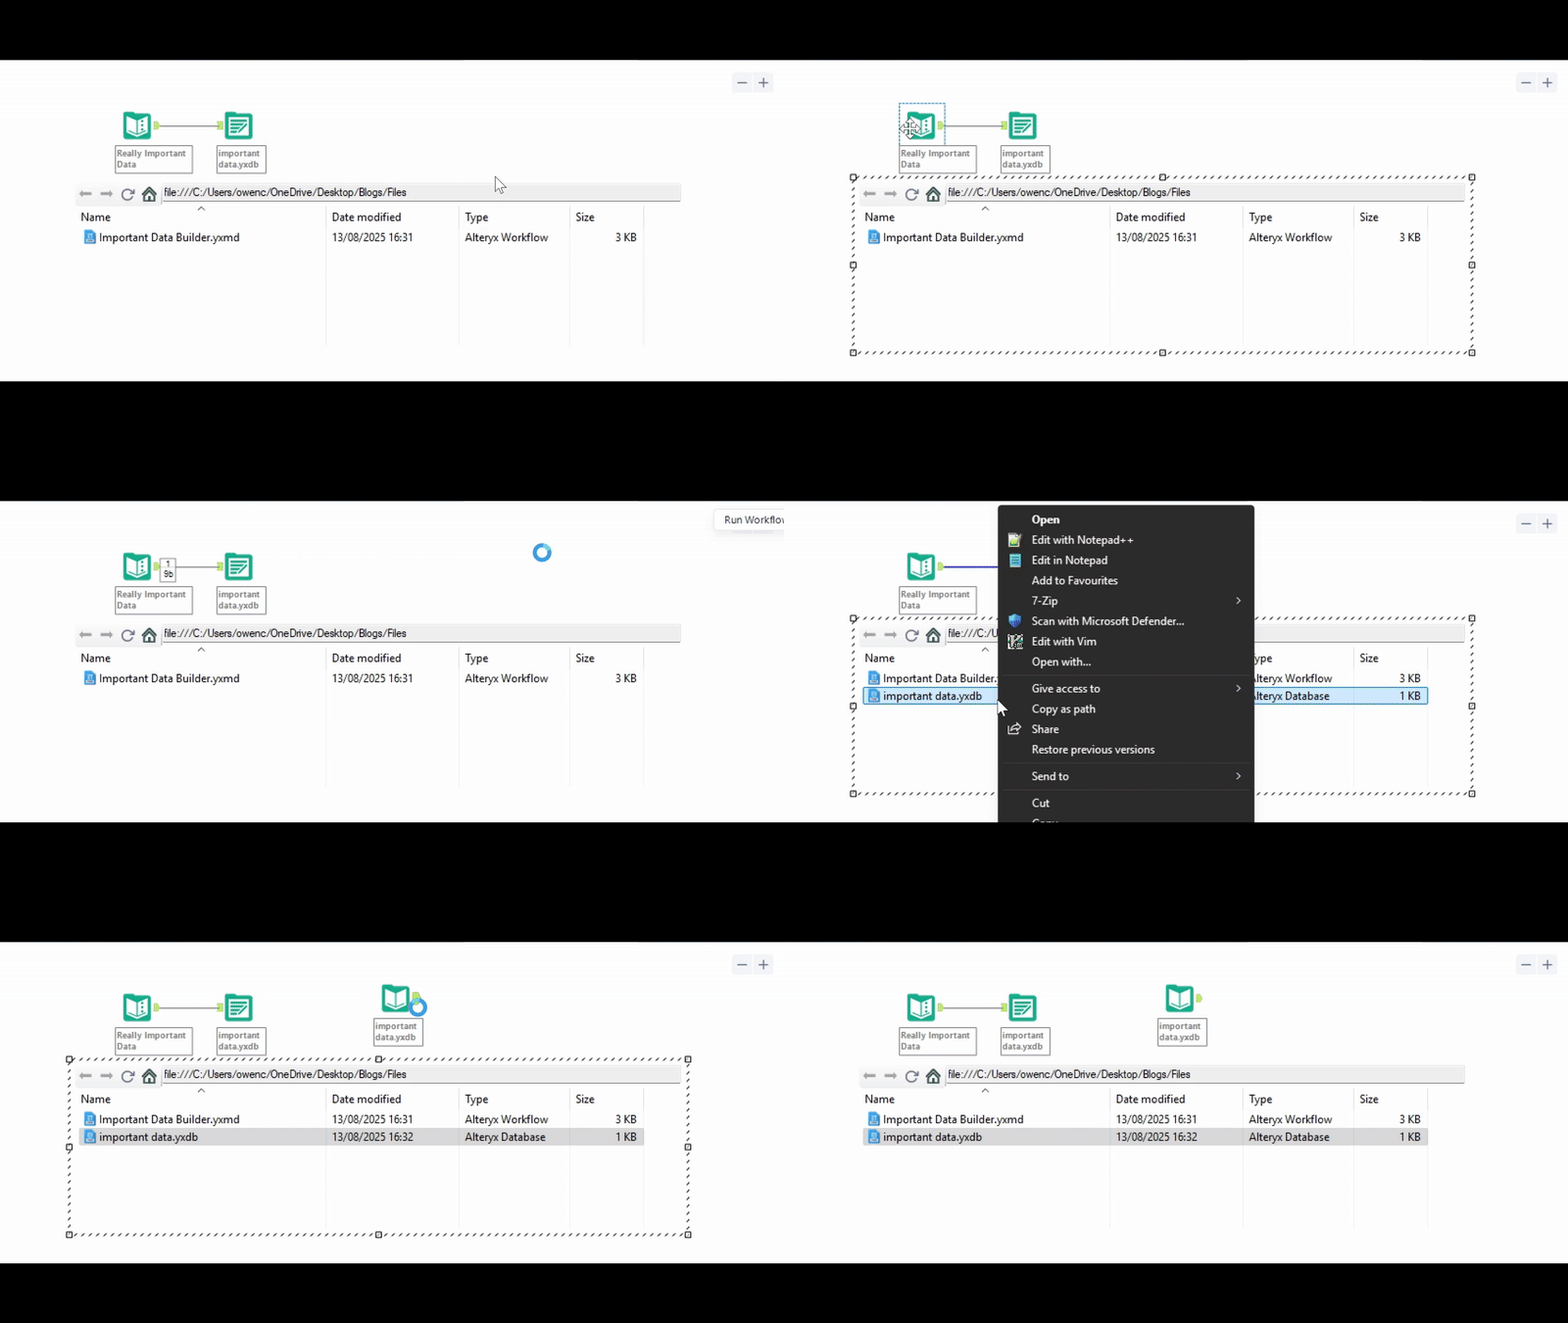
But here’s something fun: pointing it at a folder path instead. Now you can see and interact with files in that folder directly from within Alteryx. Perfect for quickly validating your output file without leaving Alteryx:
4. 🔍 Expression Text Size
This one is simple, but I use it many times in a day.
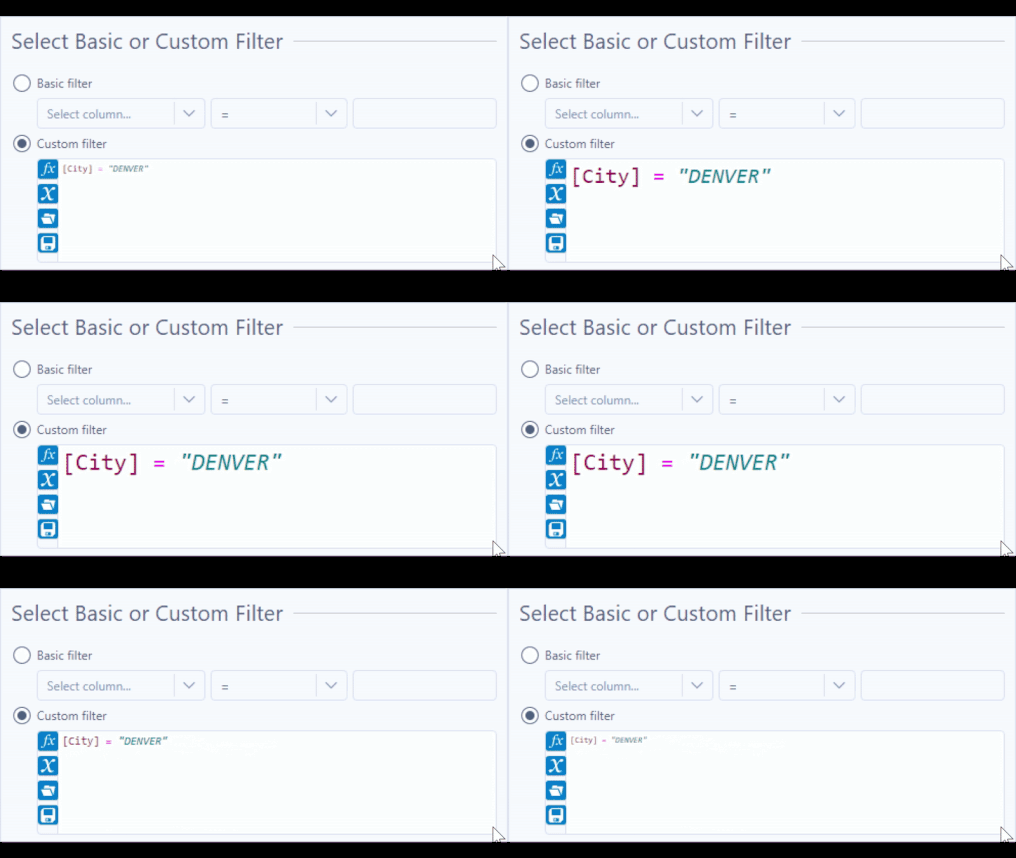
While in an expression editor (Formula, Filter Tool…), hold ctrl and scroll to increase or decrease the text size. This one is great for eye comfort, but is a lifesaver when sharing screen with Steve from finance. He really tries, bless him…
5. 📊 Browse tool Interactivity
The browse tool is fantastic – but some features feel hidden under the hood.
Did you know that you can profile a subset of your data by filtering your data directly in the results window?
Notice how after filtering, the browse tool reflects the 43 records currently in the results window:
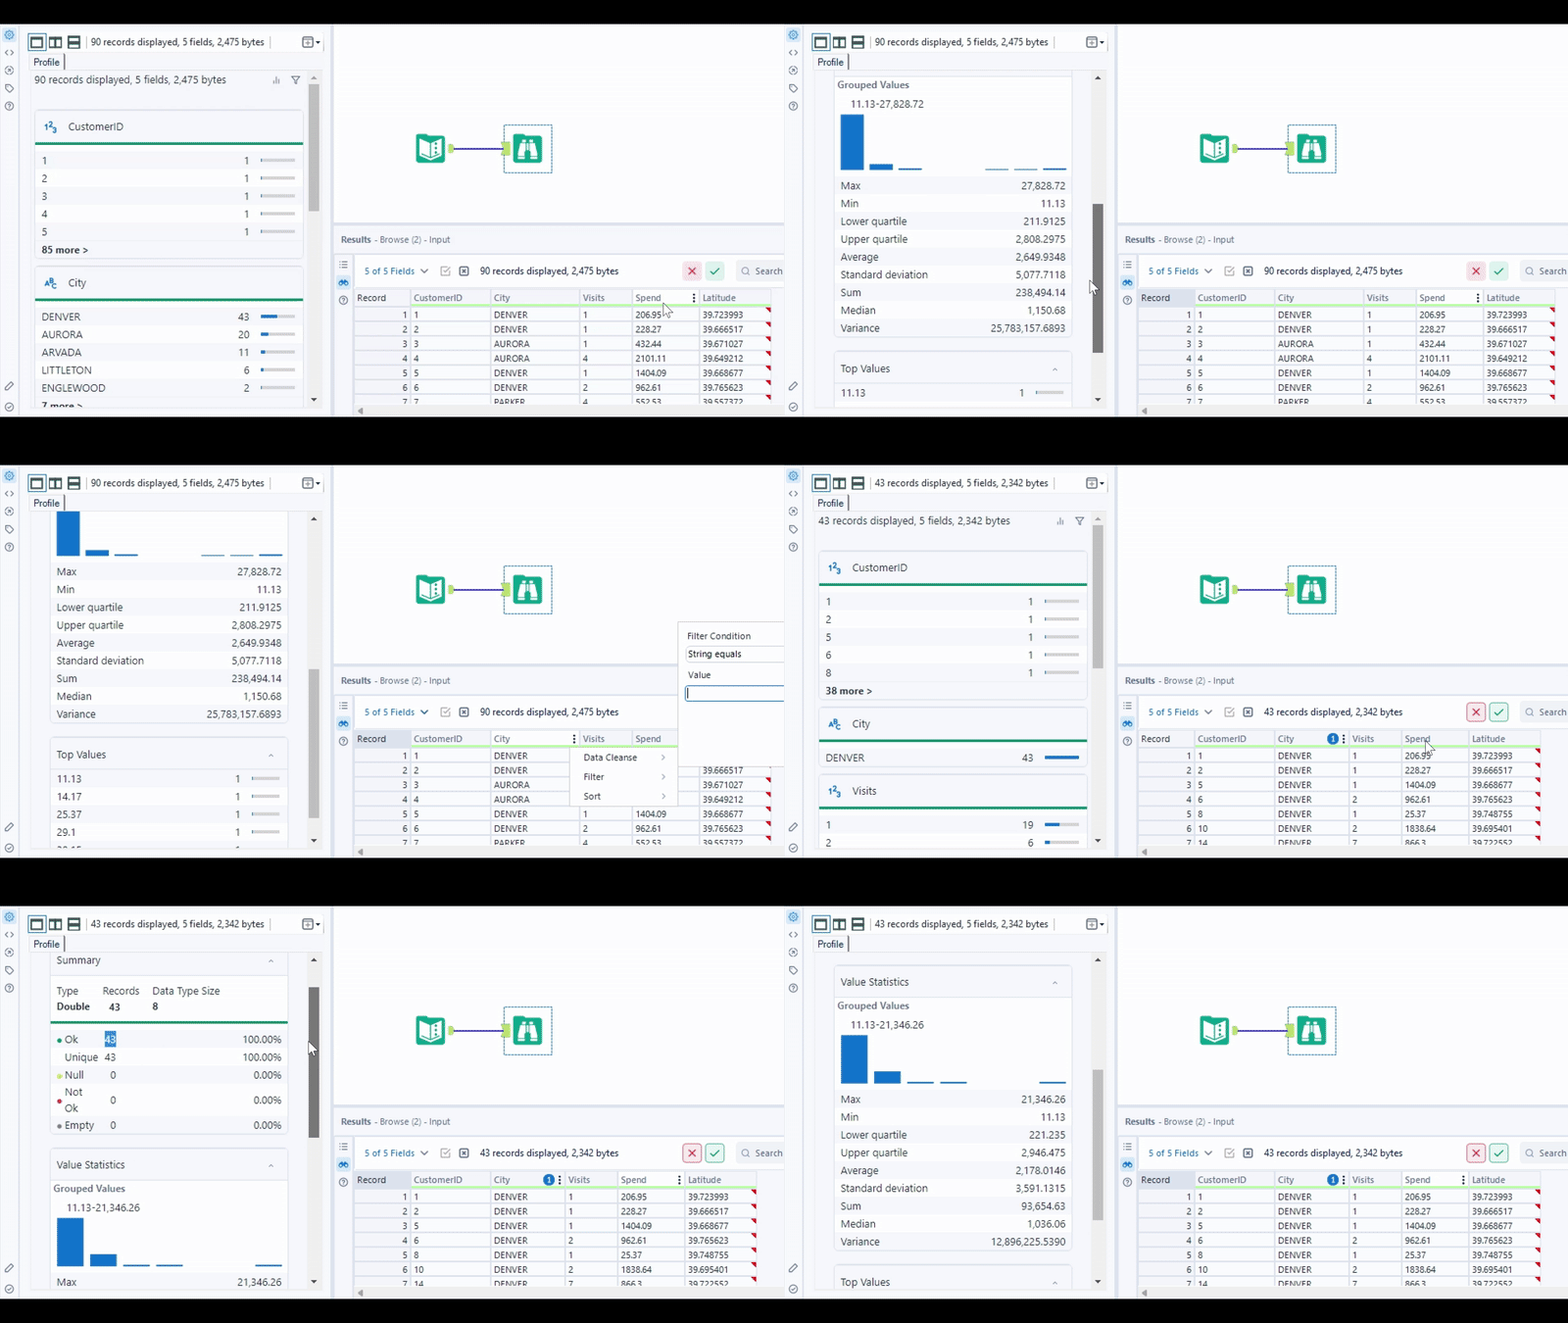
As a quick bonus trick, have you noticed these icons in the top right of the browse tool? They allow you to show a histogram by default, and filter your profiled columns easily:

That is it for this episode of 5 Alteryx Tricks You Didn’t Know!
5 very quick tricks that can massively improve your data visibility. Did I miss something? Got an even better trick to share? Drop it in the comments below – share the knowledge!