Bring your best ideas to the AI Use Case Contest! Enter to win 40 hours of expert engineering support and bring your vision to life using the powerful combination of Alteryx + AI. Learn more now, or go straight to the submission form.
Search
Close
Start Free Trial
Turn on suggestions
Auto-suggest helps you quickly narrow down your search results by suggesting possible matches as you type.
Showing results for
Cloud Quests
Elevate your workflow skills by solving real-world challenges using the Alteryx Analytics Cloud Platform.- Community
- :
- Community
- :
- Learn
- :
- Academy
- :
- Challenges & Quests
- :
- Cloud Quests
- :
- Cloud Quest #2: Consumer Purchase Aggregation
Cloud Quest #2: Consumer Purchase Aggregation
Options
- Subscribe to RSS Feed
- Mark Topic as New
- Mark Topic as Read
- Float this Topic for Current User
- Bookmark
- Subscribe
- Mute
- Printer Friendly Page
JJungers
Alteryx Alumni (Retired)
04-12-2024
09:42 AM
- Mark as New
- Bookmark
- Subscribe
- Mute
- Subscribe to RSS Feed
- Permalink
- Notify Moderator
Diederik_vander
8 - Asteroid
04-15-2024
04:46 AM
- Mark as New
- Bookmark
- Subscribe
- Mute
- Subscribe to RSS Feed
- Permalink
- Notify Moderator
ed_hayter
13 - Pulsar
05-13-2024
09:34 AM
- Mark as New
- Bookmark
- Subscribe
- Mute
- Subscribe to RSS Feed
- Permalink
- Notify Moderator

TigiPaz
5 - Atom
05-13-2024
07:28 PM
- Mark as New
- Bookmark
- Subscribe
- Mute
- Subscribe to RSS Feed
- Permalink
- Notify Moderator
Dlawless610
7 - Meteor
05-16-2024
12:01 PM
- Mark as New
- Bookmark
- Subscribe
- Mute
- Subscribe to RSS Feed
- Permalink
- Notify Moderator

15 - Aurora
05-21-2024
12:34 PM
- Mark as New
- Bookmark
- Subscribe
- Mute
- Subscribe to RSS Feed
- Permalink
- Notify Moderator

Tom_Pilgrem
8 - Asteroid
05-27-2024
11:38 PM
- Mark as New
- Bookmark
- Subscribe
- Mute
- Subscribe to RSS Feed
- Permalink
- Notify Moderator

17 - Castor
05-28-2024
07:04 AM
- Mark as New
- Bookmark
- Subscribe
- Mute
- Subscribe to RSS Feed
- Permalink
- Notify Moderator
Second one in the books.
I think it's unfair doing these challenges while being distracted by @joshuaburkhow 's face on the first page.
Spoiler
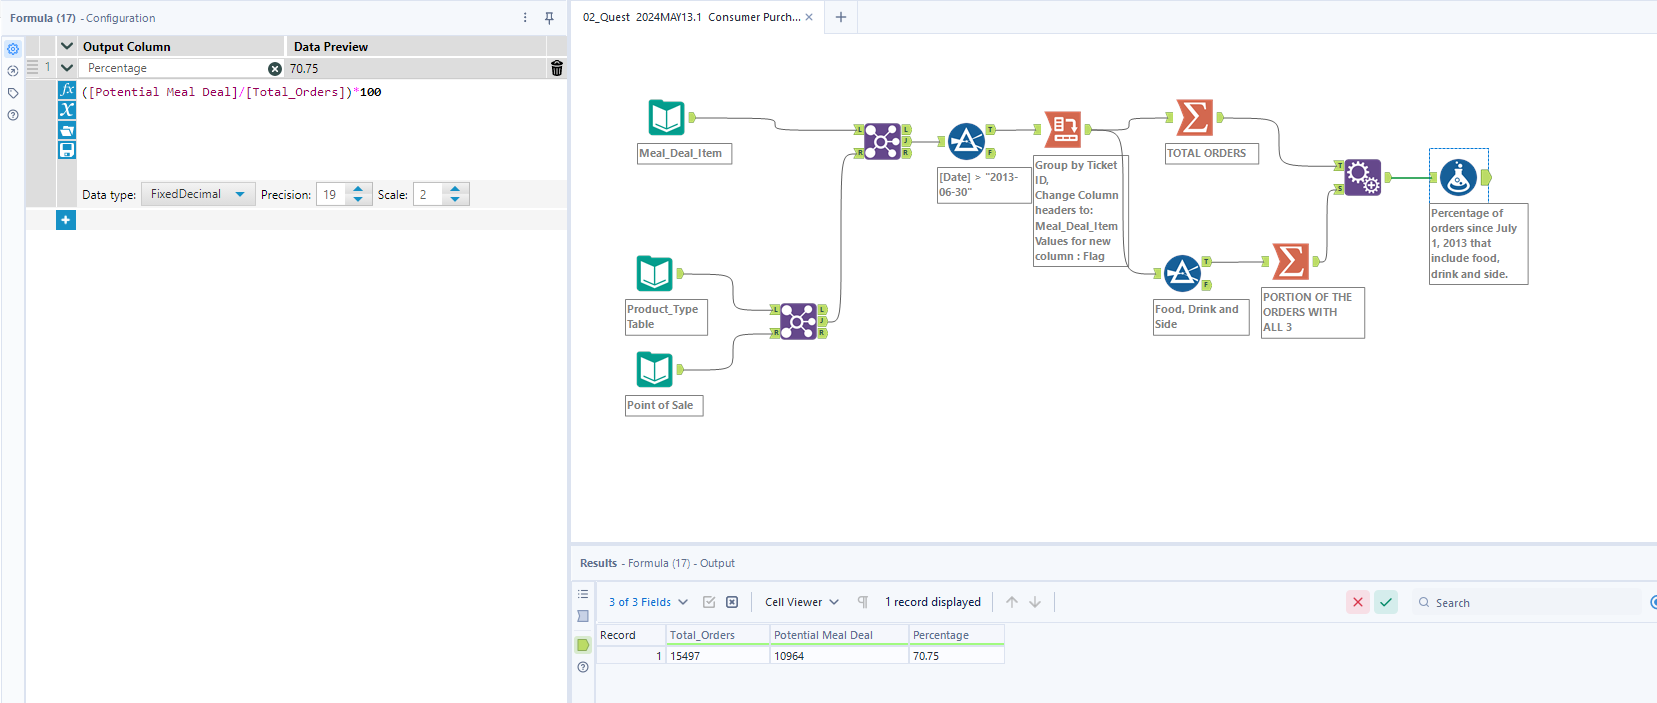
So, I brought the files in and joined them together, keeping the Point of Sale dataset as primary. I then ensured the Date field was assigned the correct data format, then filtered to only show those orders since 2013-07-01. I then counted the total orders along one stream, and on another stream filtered it down to the orders that contained Pizza or Burger and had a side and a drink. Appended these to values together and calculated the percentage of the total orders. Simple.

So, I brought the files in and joined them together, keeping the Point of Sale dataset as primary. I then ensured the Date field was assigned the correct data format, then filtered to only show those orders since 2013-07-01. I then counted the total orders along one stream, and on another stream filtered it down to the orders that contained Pizza or Burger and had a side and a drink. Appended these to values together and calculated the percentage of the total orders. Simple.
Towers
11 - Bolide
05-30-2024
08:48 AM
- Mark as New
- Bookmark
- Subscribe
- Mute
- Subscribe to RSS Feed
- Permalink
- Notify Moderator
A fun one!

13 - Pulsar
06-12-2024
07:55 AM
- Mark as New
- Bookmark
- Subscribe
- Mute
- Subscribe to RSS Feed
- Permalink
- Notify Moderator
Quest #2 complete!

Labels
-
Advanced
1 -
App Builder
1 -
Auto Insights
1 -
Basic
17 -
Core
1 -
Data Analysis
10 -
Data Cleansing
1 -
Data Parsing
1 -
Data Preparation
4 -
DateTime
3 -
Designer Cloud
44 -
Developer
2 -
Difficult
2 -
Generate Rows
2 -
Generative AI
1 -
Intermediate
25 -
Join
13 -
Machine Learning
1 -
Math Functions
3 -
Multi-Tools
2 -
Parse
17 -
Preparation
21 -
Regex
3 -
Reporting
1 -
Spatial
1 -
Time Series
1 -
Transform
19
- « Previous
- Next »