Analytics
News, events, thought leadership and more.- Subscribe to RSS Feed
- Mark as New
- Mark as Read
- Bookmark
- Subscribe
- Printer Friendly Page
- Notify Moderator
In my last entry on our new predictive analytics enhancements for our latest platform, Alteryx Analytics 9.0, I discussed our partnership with Revolution Analytics. Now let me tell you about the other predictive enhancements 9.0 has to offer.
In addition to the XDF Input and XDF Output tools, Alteryx Analytics 9.0 has three additional tools in its Predictive Analytics toolbox. Two of these tools are new modeling methods (the Spline Model and the Gamma Regression tools), and the third is a new plotting tool (the Heat Plot). These tools grew out of specific user requests, and we felt they represented additions to Alteryx that would be of interest to many users.
The Spline Model tool provides the multivariate adaptive regression splines (or MARS) algorithm. This method is a modern statistical learning model that:
- self-determines which subset of fields best predict a target field of interest;
- captures highly nonlinear relationships and interactions between fields; and
- automatically addresses a broad range of regression and classification problems in a way that can be transparent to the user (the user can do as little as specify a target field and a set of predictor fields, but the tool can be extensively fine-tuned by advanced users).
Its basic approach is similar to the recursive partitioning algorithm (used in the Decision Tree tool) in that it finds the variables that matter most in predicting the target, as well as finding appropriate split points (known as "knots") in those predictor variables. However, unlike in a decision tree, a line between adjacent knots (called a “term”) is fit rather than using discrete jumps as is done in decision trees. This results in the construction of a piecewise linear function for each variable that can closely approximate any relationship between the target and a predictor variable.
In many applications, the values of the target variable are always strictly positive (i.e., are never zero or negative), but tend to cluster toward the lower range of the observed values, but in a small minority of cases take on large values. Target variables of this type represent a data generation process that is not consistent with the Normality assumptions underlying the traditional linear regression model. However, the values are always positive and do not have to all be integer numbers, so they do not follow a Poisson distribution or Negative Binomial distribution-based process. They are consistent with a process based on a Gamma distribution, and can be estimated using methods similar to linear regression, via the generalized linear model framework. The Gamma Regression Tool implements this model.

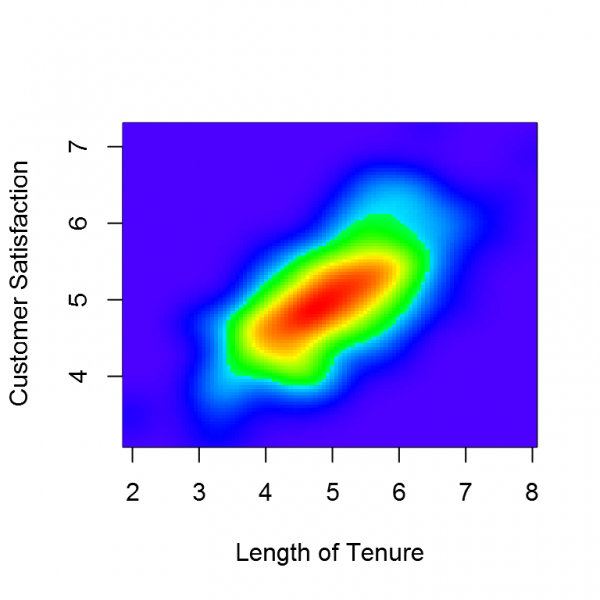
The Heat Plot tool uses a heat plot color map to show the joint distribution of two variables that are either continuous numeric variables or ordered categories (categorical variables that have a natural order, such as income groups or educational attainment levels). For example, this tool can provide an indication of the joint distribution of customer satisfaction and the length of time a customer has been with the company, highlighting potential problem and success hot-spots with respect to customer tenure.
The final important area of improvement is in the behavior and reporting capabilities of the A/B Testing suite of tools, particularly the AB Analysis tool, which greatly expands the types of A/B tests the tools can address. We worked closely with several of our customers to better meet their needs, and the changes in these tools reflect their input.
We feel that the changes in the predictive analytics tools in the 9.0 release reflect major improvements in the day-to-day usability of these tools, and the scope of problems they can address. Moreover, many of our tools have undergone major changes that reflect a solid maturation in their capabilities.
Try Alteryx Analytics 9.0 yourself with the Alteryx trial version on our Website.

Chief Scientist
Dr. Dan Putler is the Chief Scientist at Alteryx, where he is responsible for developing and implementing the product road map for predictive analytics. He has over 30 years of experience in developing predictive analytics models for companies and organizations that cover a large number of industry verticals, ranging from the performing arts to B2B financial services. He is co-author of the book, “Customer and Business Analytics: Applied Data Mining for Business Decision Making Using R”, which is published by Chapman and Hall/CRC Press. Prior to joining Alteryx, Dan was a professor of marketing and marketing research at the University of British Columbia's Sauder School of Business and Purdue University’s Krannert School of Management.
Dr. Dan Putler is the Chief Scientist at Alteryx, where he is responsible for developing and implementing the product road map for predictive analytics. He has over 30 years of experience in developing predictive analytics models for companies and organizations that cover a large number of industry verticals, ranging from the performing arts to B2B financial services. He is co-author of the book, “Customer and Business Analytics: Applied Data Mining for Business Decision Making Using R”, which is published by Chapman and Hall/CRC Press. Prior to joining Alteryx, Dan was a professor of marketing and marketing research at the University of British Columbia's Sauder School of Business and Purdue University’s Krannert School of Management.
You must be a registered user to add a comment. If you've already registered, sign in. Otherwise, register and sign in.