Alteryx Designer Desktop Discussions
Find answers, ask questions, and share expertise about Alteryx Designer Desktop and Intelligence Suite.- Community
- :
- Community
- :
- Participate
- :
- Discussions
- :
- Designer Desktop
- :
- Re: Grouping lines for different columns
Grouping lines for different columns
- Subscribe to RSS Feed
- Mark Topic as New
- Mark Topic as Read
- Float this Topic for Current User
- Bookmark
- Subscribe
- Mute
- Printer Friendly Page
- Mark as New
- Bookmark
- Subscribe
- Mute
- Subscribe to RSS Feed
- Permalink
- Notify Moderator
Hello community,
I need your help !
Basically I have an input see picture and I want to put the data from the different line on the top of each columns like in the output picture.
An idea ?
Thanks in advance !
Solved! Go to Solution.
- Labels:
-
Transformation
- Mark as New
- Bookmark
- Subscribe
- Mute
- Subscribe to RSS Feed
- Permalink
- Notify Moderator
- Mark as New
- Bookmark
- Subscribe
- Mute
- Subscribe to RSS Feed
- Permalink
- Notify Moderator
This is relatively straight forward.
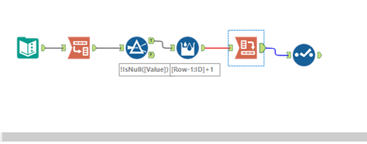
Start by transposing your data. This will give you a two column list. One column will give the column name, the 2nd column will give the value.
Then filter out lines which are NULL().
The next step would be to create a recordID which increases from 1 to n within each group; you can achieve this using the multi-row formula tool.
Finally you can then use the cross-tab tool to bring your data back in line, grouping by this new ID field, using the 'name' field as our header and the value field as our values.
Workflow attached.
Ben
- Mark as New
- Bookmark
- Subscribe
- Mute
- Subscribe to RSS Feed
- Permalink
- Notify Moderator
- Mark as New
- Bookmark
- Subscribe
- Mute
- Subscribe to RSS Feed
- Permalink
- Notify Moderator
Thank you !!!
-
Academy
5 -
ADAPT
2 -
Adobe
203 -
Advent of Code
2 -
Alias Manager
77 -
Alteryx Copilot
23 -
Alteryx Designer
7 -
Alteryx Editions
78 -
Alteryx Practice
19 -
Amazon S3
149 -
AMP Engine
250 -
Announcement
1 -
API
1,205 -
App Builder
114 -
Apps
1,358 -
Assets | Wealth Management
1 -
Basic Creator
13 -
Batch Macro
1,544 -
Behavior Analysis
244 -
Best Practices
2,688 -
Bug
719 -
Bugs & Issues
1 -
Calgary
67 -
CASS
53 -
Chained App
266 -
Common Use Cases
3,815 -
Community
24 -
Computer Vision
85 -
Connectors
1,422 -
Conversation Starter
3 -
COVID-19
1 -
Custom Formula Function
1 -
Custom Tools
1,932 -
Data
1 -
Data Challenge
9 -
Data Investigation
3,479 -
Data Science
2 -
Database Connection
2,214 -
Datasets
5,211 -
Date Time
3,224 -
Demographic Analysis
185 -
Designer Cloud
734 -
Developer
4,350 -
Developer Tools
3,520 -
Documentation
525 -
Download
1,034 -
Dynamic Processing
2,926 -
Email
925 -
Engine
145 -
Enterprise (Edition)
1 -
Error Message
2,248 -
Events
195 -
Expression
1,866 -
Financial Services
1 -
Full Creator
2 -
Fun
2 -
Fuzzy Match
709 -
Gallery
664 -
GenAI Tools
2 -
General
2 -
Google Analytics
155 -
Help
4,698 -
In Database
964 -
Input
4,285 -
Installation
357 -
Interface Tools
1,895 -
Iterative Macro
1,089 -
Join
1,952 -
Licensing
249 -
Location Optimizer
60 -
Machine Learning
259 -
Macros
2,846 -
Marketo
12 -
Marketplace
23 -
MongoDB
82 -
Off-Topic
4 -
Optimization
748 -
Output
5,234 -
Parse
2,319 -
Power BI
227 -
Predictive Analysis
936 -
Preparation
5,154 -
Prescriptive Analytics
205 -
Professional (Edition)
4 -
Publish
256 -
Python
850 -
Qlik
39 -
Question
1 -
Questions
2 -
R Tool
476 -
Regex
2,337 -
Reporting
2,428 -
Resource
1 -
Run Command
571 -
Salesforce
276 -
Scheduler
410 -
Search Feedback
3 -
Server
625 -
Settings
930 -
Setup & Configuration
3 -
Sharepoint
624 -
Spatial Analysis
597 -
Starter (Edition)
1 -
Tableau
511 -
Tax & Audit
1 -
Text Mining
468 -
Thursday Thought
4 -
Time Series
430 -
Tips and Tricks
4,176 -
Topic of Interest
1,122 -
Transformation
3,713 -
Twitter
23 -
Udacity
84 -
Updates
1 -
Viewer
3 -
Workflow
9,940
- « Previous
- Next »


