Engine Works
Under the hood of Alteryx: tips, tricks and how-tos.- Community
- :
- Community
- :
- Learn
- :
- Blogs
- :
- Engine Works
- :
- Reporting in Alteryx: Generating a PowerPoint With...
- Subscribe to RSS Feed
- Mark as New
- Mark as Read
- Bookmark
- Subscribe
- Printer Friendly Page
- Notify Moderator
Did you know you can output PowerPoints in Alteryx?
Source: GIPHY
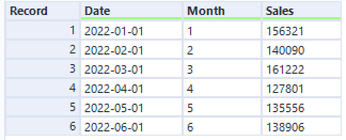
I used Alteryx to automatically generate monthly PowerPoint presentations for two different use cases at my last company: HR headcount and manufacturing productivity reporting. In both projects, stakeholders were amazed that they could eliminate hours of manual Excel work and copying/pasting/formatting to get to their monthly presentations. So, I wanted to share the magic with you all today.
Let’s dive into how to automate your PowerPoints with Alteryx!
The Tools
In my example workflow (which I have attached at the bottom of this article), the Reporting tools are the stars of the show. Here’s a quick look at the tools I used:
Interactive Chart Tool
I used this tool to create a line graph with data for my presentation. It can create all kinds of charts: box and whisker, bar, candlestick, heatmap, scatter, and pie charts.
Report Text Tool
The Report Text tool allows you to format text and include data fields. For example, to make the title for the PowerPoint slide, I created a dynamic text field that will change as the data changes by using the Available Fields drop-down.
Image Tool
I used the Image tool to bring in a logo to add to the PowerPoint slide. This tool allows you to retrieve the image from a location on your computer or store the static image in the workflow.
Layout Tool
The Layout tool allows you to combine multiple elements from reporting tools together. I will go into more depth on this in the next section.
Render Tool
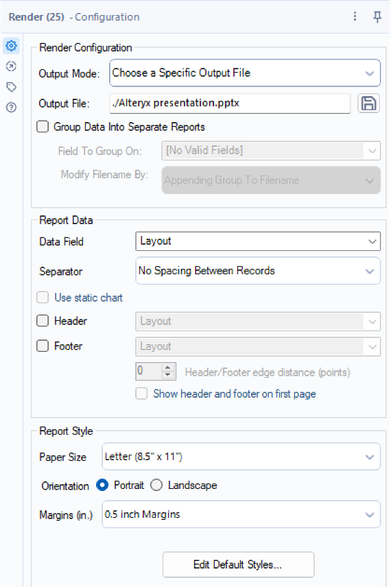
The Render tool is like the output data tool but for reporting. It allows you to output a temporary file, or you can specify a path and file type. The file type output options are Word Doc, Excel Spreadsheet, MHTML file, PowerPoint, or PNG.
The Workflow
Time to put all the reporting tools together!
I used dummy sales data in the Text Input tool for this workflow.
I wanted to show the sales over time in a graph, so I used the interactive chart tool, configured like so:
I also wanted content in my PowerPoint slide showing average monthly and total sales. For this, I used Summarize tools to get the data fields and then used a Report Text tool to create some nicely formatted slide commentary:
The data output from the Summarize tool
The configuration of the Report Text tool
I also used a Report Text tool for the title of the PowerPoint slide. For this one, I played around with the text formatting to help the text stand out.
Now that I have the main elements of the slide (the graph, commentary, and title), it’s time for an embellishment—we can add the company’s logo to make this PowerPoint more official.
Using the Image tool, I pulled in the Alteryx logo and stored the static image in the workflow:
The image looks blurry in the configuration window, but it will render with the original resolution of the PNG at the end.
Once I had all of the elements I wanted in my PowerPoint in the workflow, I used the layout tool to stack the elements on top of each other. This example is relatively simple, but for other projects, you may have to play around with the positioning and cell padding between elements to make the slide look the way you want. You can use Browse tools to check how the formatting looks in between steps, but ultimately you will need to use the Render tool to test writing the PowerPoint and check how the arrangement looks on the slides.
Once I was ready to see how the layout looked on a PowerPoint slide, I added a Render tool configured to output a PowerPoint file:
The Result
Depending on what version of PowerPoint you have on your computer, you may get this message when you open the file:
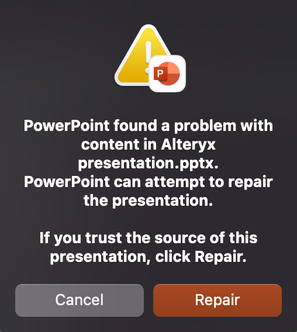
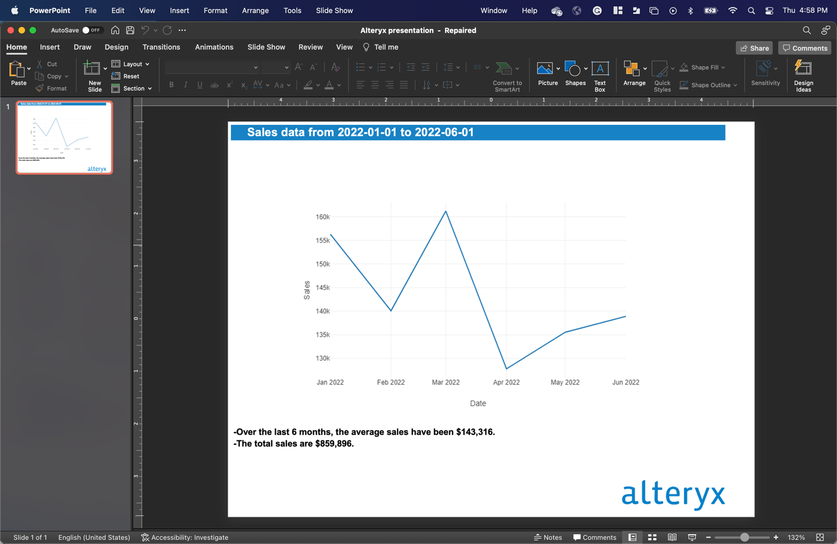
Once you click repair, you can see the presentation that Alteryx generated.
Here is what the generated PowerPoint looks like:
Pretty cool, right? You can also edit any text and drag the elements around if you prefer to finish up the formatting in PowerPoint. Or, if you are not satisfied with the look, you can go back to Alteryx and make edits there.
In past projects, I have created 8-page PowerPoints. Once you get the process down for one slide, it is not hard to replicate that formatting with different data and slide content. I also used a PowerPoint template as a background in previous projects: I saved the template as PNG files and loaded them into Alteryx. Using the Overlay tool, I set the template images as the background and overlaid the elements from Alteryx on top. This created a polished PowerPoint deck. (I did have to change the aspect ratio on the original template—Alteryx outputs the standard 4:3 aspect ratio, while many businesses use the 16:9 aspect ratio for their templates.)
The formatting can be the most time-consuming part of using the reporting tools, but in the end, you can save time because your workflow can be re-used if the reporting is cyclical (like a monthly sales report).
Conclusion & Further Application
I used dummy data in this example, but this process becomes more of a time saver when you can automate your data cleaning in addition to the PowerPoint creation.
Another interesting application is that you can batch output files with the Render tool. If you check the box “Group Data Into Separate Reports,” you can create a separate PowerPoint for every field value. To extend this example, you could create a monthly sales presentation for every salesperson in the organization just by running one workflow.
Keep your eye out for more reporting tools articles coming soon!

Sr. Content Manager
Hi, I'm Megan! I am a Sr. Content Manager at Alteryx. I work to make sure our blogs and podcast have high quality, helpful, and engaging content. If you want to create content for the Community, send me a DM and I can help you get started! I am very active on LinkedIn, so you can connect with me there as well.
Hi, I'm Megan! I am a Sr. Content Manager at Alteryx. I work to make sure our blogs and podcast have high quality, helpful, and engaging content. If you want to create content for the Community, send me a DM and I can help you get started! I am very active on LinkedIn, so you can connect with me there as well.
You must be a registered user to add a comment. If you've already registered, sign in. Otherwise, register and sign in.


