Written in collaboration with @MacRo
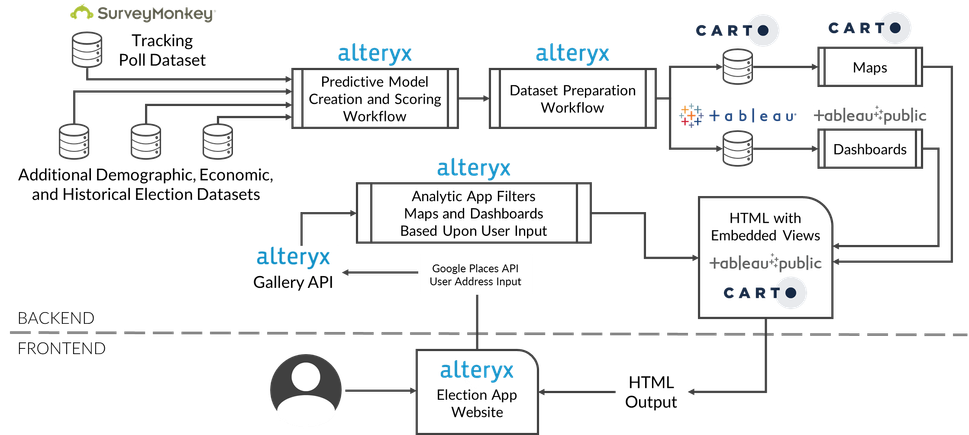
If you haven't had a chance, please checkout the Decision 2016 Presidential Election application. The app predicts who the winning candidate will be within a given U.S. neighborhood, as well as breaks down the outcome by demographics such as age, education, income, and race. Data from SurveyMonkey and the blending, spatial, predictive and Gallery API functions in Alteryx are used to create predictions that are beautifully displayed with help from Carto and Tableau. This post will walk through the architecture used to accomplish this.
Figure 1: High-level architecture of the app
Starting with the Frontend . . .
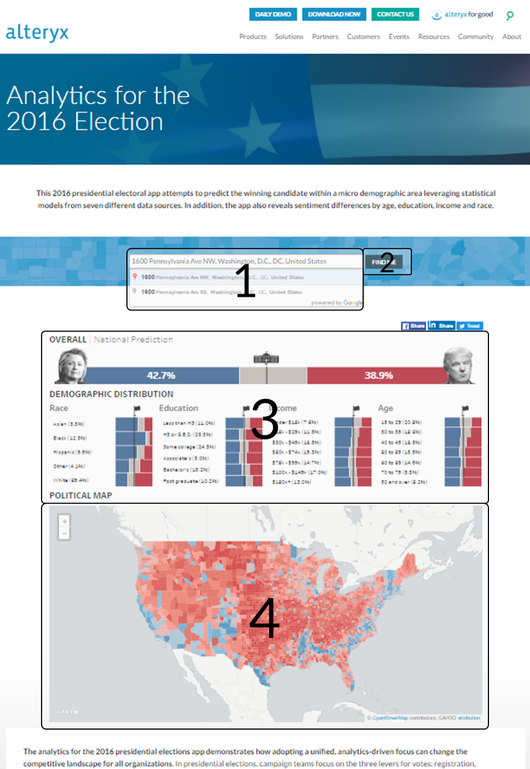
The landing page contains four key functional pieces of the app:
- Text input field connected to the Google Places API
- Button that executes the Alteryx Gallery API call
- Embedded Carto choropleth map displaying county level voter preference
- Embedded Tableau dashboard with aggregated national results
Figure 2: Annotated screenshot of the landing page - shown before running the app
The
Google Places API was used to provide address suggestions and geocode the address. When an address is selected, the Google Places API responds with a JSON object containing details for the address.
Figure 3: JSON response from Google Places API
Moving to the Backend . . .
Prediction Dataset
The foundation of the app is a prediction dataset. A generalized, boosted regression model was created using
SurveyMonkey tracking poll data, historical election results, economic, and demographic data sets found in the
data package. Look for an upcoming blog post that will detail the modeling process for the prediciton dataset.
Data Preparation Workflow
The preparation workflow ingests the prediction dataset and re-structures it to support the visualizations in Carto and Tableau. Two datasets, census tract and county, are uploaded to Carto using the
Publish to Carto connector. The ability to output to a Tableau Data Extract (TDE) is used for the Tableau Public dashboards; which requires data to be in TDE format. Two TDEs were created - a granular, census tract version and a nationally aggregated version.
Carto Maps
Three maps were created using Carto. A national choropleth map was created to show voter preference at the county level without any county outlines - this is the initial map on
www.alteryx.com/election. Another county level map was created with two layers. The first layer is a choropleth map showing voter preference. The second layer shows a yellow border around the county containing the address entered. A similar map was created at the census tract level.
Tableau Dashboards
Two Tableau dashboards were created. The census tract TDE was used to create a dashboard that allowed for excluding all but one census tract. The other dashboard showed nationally aggregated results. Both the national and local dashboards were built with
Tableau Desktop 10.0 and published to
Tableau Public.
HTML Output Page
Both Tableau and Carto provide the ability to embed a visualization within another webpage.
Figure 5: For Tableau, we used an embedded URL to display the dashboard within an iframe on the output page
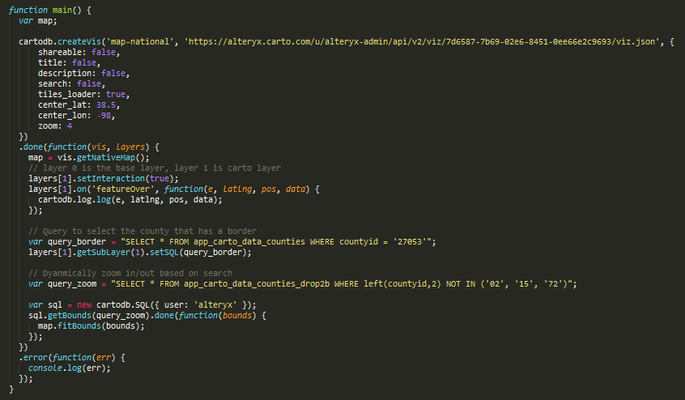
Figure 6: For Carto, we used the CARTO.js library to create and dynamically filter the map within the output page
Analytic App
The Election Analytic App, hosted on the
Alteryx Gallery, ingests the latitude and longitude provided by the Google JSON object. Using the latitude and longitude, the address census tract and adjoining census tracts are identified. Knowing the set of census tracts we want to display, the app ingests the HTML output page discussed above. With the
RegEx tool, the HTML/JS code for Tableau and Carto is updated to show only data that's relevant to the address entered. Once the page code has been updated, it's written out and displayed in an iframe on the election app website.
Figure 7: JavaScript code used to check the status of the app and embed the HTML output into the page
Summary
The Decision 2016 Presidential Election app used many features of the Alteryx Analytics Platform. The prediction dataset was created using the predictive, spatial, and data blending capabilities of
Alteryx Designer. The prediction dataset also made use of the
Alteryx Strategic Analytics Data Sets; specifically, the U.S. Census and American Community Survey datasets. The extensible nature of Alteryx Designer was highlighted through the integration with Carto and Tableau. Last but certainly not least, the Gallery and Gallery API were critical in providing custom results based on user input.
Have additional questions on the technical details? Please comment below and we'll be happy to answer.


